flowchart TD
A[start] --> B(hello)
B --> C[end]
Magically Right Size the Compute Resources Dedicated to Your AI/ML Workloads
Gergely Daroczi
2025-09-02

Outerbounds Office Hours
with Spare Cores
Gergely Daroczi
Sep 2, 2025
Slides: sparecores.com/talks
Press Space or click the green arrow icons to navigate the slides ->
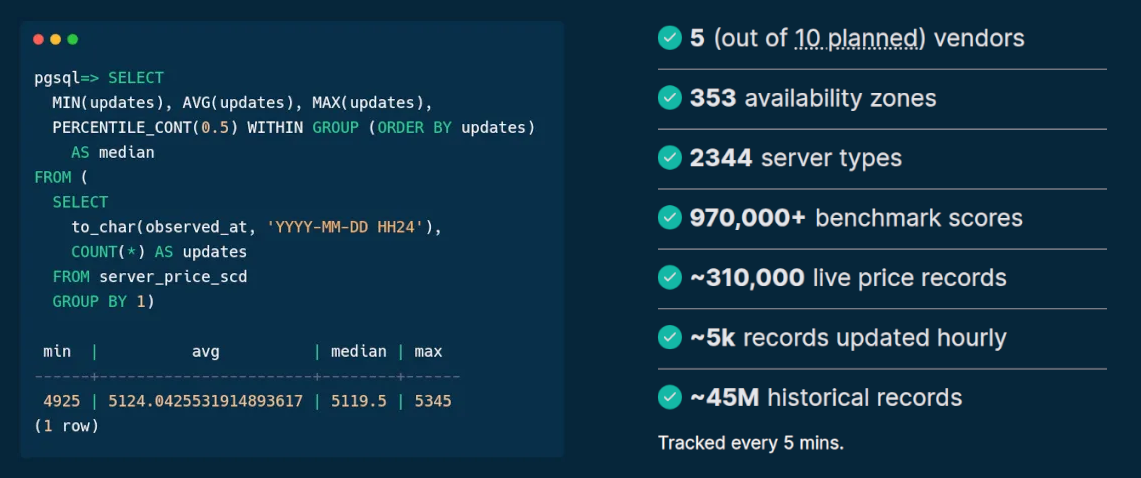
>>> from sparecores import badges
- Vendor independent, open-source project
- Funded by NGI Search (EU consortium under Horizon Europe)
- Accepted into the NVIDIA Inception Program
- Beneficiary of cloud credits from 5 vendors (overall ~$100k)
- 10+ conference talks in 6 countries (e.g. Berlin Buzzwords, KCD)
- Featured by The Pragmatic Engineer in Oct 2024
- Jeff Barr (Chief Evangelist at AWS) on our Reddit post:
This was awesome, thanks for sharing.
>>> from sparecores import intro
- Open-source tools, database schemas and documentation to inspect and inventory cloud vendors and their offerings, including pricing and measured performance via benchmark workloads.
>>> from sparecores import intro
- Open-source tools, database schemas and documentation to inspect and inventory cloud vendors and their offerings, including pricing and measured performance via benchmark workloads.
- Managed infrastructure, databases, APIs, SDKs, and web applications to make this data publicly accessible.
- Open-source helpers to select, start and manage instances in your own environment.
- Open-source Python/R packages and workflow orchestration extensions (e.g. Metaflow) to track resource usage and cost of DS/ML/AI jobs. Open-source tooling to right-size instances.
- Add-on services to scale data science workflows, even without direct vendor engagement.
>>> import 
Workflow orchestration for real-life ML, AI, and DS projects.
- started at Netflix
- open-source (since 2019)
- supports Python and R
- maintained by Netflix and Outerbounds
- human-centric
- reproducible by design
- scalable
>>> from metaflow import tutorial
from metaflow import FlowSpec, step

class HelloFlow(FlowSpec):
    @step
    def start(self):
        print("HelloFlow is starting.")
        self.next(self.hello)

    @step
    def hello(self):
        print("Metaflow says: Hi!")
        self.next(self.end)

    @step
    def end(self):
        print("HelloFlow is all done.")

if __name__ == "__main__":
HelloFlow()>>> from metaflow import tutorial
from metaflow import FlowSpec, step

class HelloFlow(FlowSpec):
    @step
    def start(self):
        print("HelloFlow is starting.")
        self.next(self.hello)

    @step
    def hello(self):
        print("Metaflow says: Hi!")
        self.next(self.end)

    @step
    def end(self):
        print("HelloFlow is all done.")

if __name__ == "__main__":
HelloFlow()>>> from DnD import dices

>>> from metaflow import dices
flowchart TD
    A[start] -. dice <br> rolls .-> B(roll)
    B -. dice <br> rolls <br> dices ..-> C[end]
from random import sample, randint
from metaflow import FlowSpec, step


class DiceRollFlow(FlowSpec):
    # D3, D4, D6, D8, D10, D12, ...
    DICES = [3, 4, 6, 8, 10, 12, 100]

    @step
    def start(self):
        self.dice = sample(self.DICES, 1)[0]
        self.rolls = sample(range(3), 1)[0] + 1
        self.next(self.roll)

    @step
    def roll(self):
        self.dices = [randint(1, self.dice) for _ in range(self.rolls)]
        self.next(self.end)

    @step
    def end(self):
        print(f"Rolled {self.rolls} times with a {self.dice} sided dice: {self.dices}")

if __name__ == "__main__":
DiceRollFlow()>>> from metaflow import dices
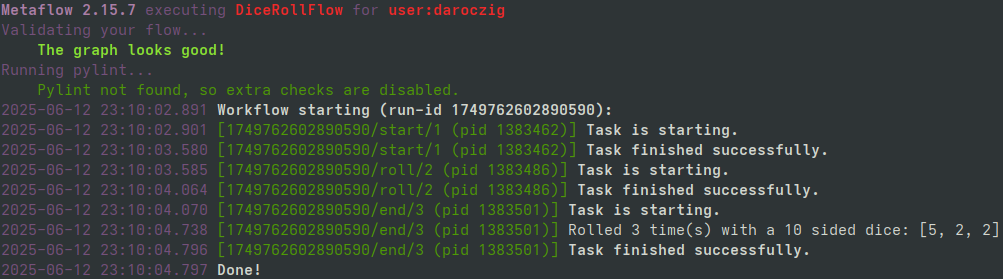
>>> from metaflow import dices
>>> from metaflow import Flow
>>> print(run := Flow("DiceRollFlow").latest_successful_run)
Run('DiceRollFlow/1749762602890590')
>>> run.created_at
datetime.datetime(2025, 9, 24, 23, 10, 2, 891000)
>>> run.data
<MetaflowData: dices, rolls, name, dice>
>>> run.data.dices
[5, 2, 2]
>>> list(run.steps())
[Step('DiceRollFlow/1749762602890590/end'), Step('DiceRollFlow/1749762602890590/roll'), Step('DiceRollFlow/1749762602890590/start')]
>>> step = next(run.steps())
>>> step.task.metadata
[Metadata(name='user', value='daroczig', created_at=1749762604068, type='user', task=Task('DiceRollFlow/1749762602890590/end/3')), ...
>>> step.task.stdout
'Rolled 3 time(s) with a 10 sided dice: [5, 2, 2]\n'
>>> step.task.artifacts.dices.data
[5, 2, 2]>>> from metaflow import more
flowchart TD
    A[start] --> B1(fitA)
    A[start] --> B2(fitB)
    B1 --> C[eval]
    B2 --> C[eval]
    C --> D[end]
class ModelingFlow(FlowSpec):

    @step
    def start(self):
        self.data = load_data()
        self.next(self.fitA, self.fitB)

    @step
    def fitA(self):
        self.model = fit(self.data, model='A')
        self.next(self.eval)

    @step
    def fitB(self):
        self.model = fit(self.data, model='B')
        self.next(self.eval)

    @step
    def eval(self, inputs):
        self.best = max((i.model.score, i.model)
                        for i in inputs)[1]
        self.next(self.end)

    @step
    def end(self):
print('done!')>>> from metaflow import more
flowchart TD
    A[start] -- data --> B1(fitA)
    A[start] -- data --> B2(fitB)
    B1 -. data<br>model .-> C[eval]
    B2 -. data<br>model .-> C[eval]
    C -- data<br>best --> D[end]
class ModelingFlow(FlowSpec):

    @step
    def start(self):
        self.data = load_data()
        self.next(self.fitA, self.fitB)

    @step
    def fitA(self):
        self.model = fit(self.data, model='A')
        self.next(self.eval)

    @step
    def fitB(self):
        self.model = fit(self.data, model='B')
        self.next(self.eval)

    @step
    def eval(self, inputs):
        self.best = max((i.model.score, i.model)
                        for i in inputs)[1]
        self.next(self.end)

    @step
    def end(self):
        print('done!')
And conditional and recursive steps since Metaflow 2.18!
>>> from metaflow import venv
flowchart TD
    style B2 fill:#eab308
    A[start] --> B1(fitA)
    A[start] --> B2(fitB)
    B1 --> C[eval]
    B2 --> C[eval]
    C --> D[end]
class ModelingFlow(FlowSpec):

    @step
    def start(self):
        self.data = load_data()
        self.next(self.fitA, self.fitB)

    @step
    def fitA(self):
        self.model = fit(self.data, model='A')
        self.next(self.eval)

    @pypi(python='3.10.11', packages={'scikit-learn': '1.7'})
    @step
    def fitB(self):
        self.model = fit(self.data, model='B')
        self.next(self.eval)

    @step
    def eval(self, inputs):
        self.best = max((i.model.score, i.model)
                        for i in inputs)[1]
        self.next(self.end)

    @step
    def end(self):
print('done!')>>> from metaflow import cloud
flowchart TD
    subgraph AWS Batch
      B1(fitA)
      B2(fitB)
    end
    A[start] .-> B1
    A[start] .-> B2
    B1 .-> C[eval]
    B2 .-> C[eval]
    C --> D[end]
class ModelingFlow(FlowSpec):

    @step
    def start(self):
        self.data = load_data()
        self.next(self.fitA, self.fitB)

    @batch(cpu=32, memory=64)
    @step
    def fitA(self):
        self.model = fit(self.data, model='A')
        self.next(self.eval)

    @batch(cpu=4, memory=16, gpu=1)
    @step
    def fitB(self):
        self.model = fit(self.data, model='B')
        self.next(self.eval)

    @step
    def eval(self, inputs):
        self.best = max((i.model.score, i.model)
                        for i in inputs)[1]
        self.next(self.end)

    @step
    def end(self):
print('done!')>>> import resource_tracker
- Lightweight (zero-dependency*) Python package
- Supports Python 3.9+
- Monitors system-level and process-level resource usage
- Tracks CPU, memory, GPU/VRAM, network, storage & more
- Ease of use, minimal setup
- Runs in the background, non-blocking
- Framework extensions (e.g. Metaflow)
* No dependencies on Linux;
psutil on other OS.
>>> import resource_tracker
Installation:
>>> resource_tracker.report().browse()
>>> ResourceTracker.system_metrics
>>> print(tracker.system_metrics)
TinyDataFrame with 221 rows and 21 columns:
timestamp    | processes | utime | stime | cpu_usage | memory_free | memory_used | memory_buffers | memory_cached | memory_active | memory_inactive | disk_read_bytes | disk_write_bytes | disk_space_total_gb | disk_space_used_gb | disk_space_free_gb | net_recv_bytes | net_sent_bytes | gpu_usage | gpu_vram | gpu_utilized
-------------+-----------+-------+-------+-----------+-------------+-------------+----------------+---------------+---------------+-----------------+-----------------+------------------+---------------------+--------------------+--------------------+----------------+----------------+-----------+----------+-------------
1756711946.0 |     720.0 |  0.62 |  0.41 |    1.0303 |  18888932.0 |  38098620.0 |         3612.0 |     8555708.0 |    25858216.0 |        110860.0 |        872448.0 |         274432.0 |             3699.99 |            2600.86 |            1099.13 |         4627.0 |         3251.0 |      0.19 |   1610.0 |          1.0
1756711947.0 |     718.0 |  0.56 |  0.51 |    1.0699 |  18878644.0 |  38108908.0 |         3612.0 |     8555708.0 |    25858092.0 |        110860.0 |         53248.0 |        5705728.0 |             3699.99 |            2600.85 |            1099.14 |         4666.0 |          952.0 |      0.18 |   1610.0 |          1.0
1756711948.0 |     718.0 |  0.65 |  0.41 |      1.06 |  18887904.0 |  38099648.0 |         3612.0 |     8555708.0 |    25873876.0 |        110860.0 |        499712.0 |              0.0 |             3699.99 |            2600.85 |            1099.14 |         4141.0 |          749.0 |      0.17 |   1610.0 |          1.0
1756711949.0 |     718.0 |  0.56 |  0.31 |      0.87 |  18893768.0 |  38093784.0 |         3612.0 |     8555708.0 |    25873732.0 |        110860.0 |          8192.0 |              0.0 |             3699.99 |            2600.85 |            1099.14 |         5230.0 |         3534.0 |      0.13 |   1610.0 |          1.0
1756711950.0 |     717.0 |   0.6 |  0.43 |    1.0301 |  18872532.0 |  38112844.0 |         3612.0 |     8557884.0 |    25876444.0 |        110860.0 |          8192.0 |              0.0 |             3699.99 |            2600.85 |            1099.14 |        11204.0 |        10237.0 |      0.14 |   1611.0 |          1.0
1756711951.0 |     717.0 |  0.67 |  0.45 |    1.1199 |  18877492.0 |  38110060.0 |         3612.0 |     8555708.0 |    25874972.0 |        110860.0 |             0.0 |              0.0 |             3699.99 |            2600.85 |            1099.14 |         4605.0 |         2372.0 |      0.12 |   1611.0 |          1.0
1756711952.0 |     722.0 |  0.61 |  0.41 |    1.0201 |  18866980.0 |  38120572.0 |         3612.0 |     8555708.0 |    25876556.0 |        110860.0 |         20480.0 |        3383296.0 |             3699.99 |            2600.85 |            1099.14 |         4569.0 |         3845.0 |      0.17 |   1611.0 |          1.0
1756711953.0 |     718.0 |  1.07 |  0.49 |      1.56 |  18883100.0 |  38101332.0 |         3612.0 |     8558828.0 |    25880244.0 |        110860.0 |        385024.0 |         606208.0 |             3699.99 |            2600.85 |            1099.14 |        27694.0 |        14736.0 |      0.32 |   1625.0 |          1.0
1756711954.0 |     718.0 |  1.06 |  0.44 |    1.5001 |  18872284.0 |  38110084.0 |         3612.0 |     8560892.0 |    25891068.0 |        110860.0 |         90112.0 |              0.0 |             3699.99 |            2600.85 |            1099.14 |        17429.0 |        16417.0 |      0.17 |   1638.0 |          1.0
1756711955.0 |     717.0 |  1.93 |  0.46 |    2.3897 |  18870824.0 |  38111536.0 |         3612.0 |     8560900.0 |    25878008.0 |        110860.0 |        692224.0 |         262144.0 |             3699.99 |            2600.85 |            1099.14 |        97172.0 |       114005.0 |      0.23 |   1656.0 |          1.0
...
>>> ResourceTracker.process_metrics
>>> print(tracker.process_metrics)
TinyDataFrame with 221 rows and 12 columns:
timestamp    | pid       | children | utime | stime | cpu_usage | memory  | read_bytes | write_bytes | gpu_usage | gpu_vram | gpu_utilized
-------------+-----------+----------+-------+-------+-----------+---------+------------+-------------+-----------+----------+-------------
1756711946.0 | 1542538.0 |      4.0 |  0.07 |  0.08 |      0.15 | 84612.0 |        0.0 |         0.0 |       0.0 |      0.0 |          0.0
1756711947.0 | 1542538.0 |      3.0 |  0.09 |  0.17 |      0.26 | 74270.0 |        0.0 |         0.0 |       0.0 |      0.0 |          0.0
1756711948.0 | 1542538.0 |      4.0 |  0.19 |  0.06 |      0.25 | 99062.0 |   945664.0 |         0.0 |       0.0 |      0.0 |          0.0
1756711949.0 | 1542538.0 |      3.0 |  0.07 |   0.1 |      0.17 | 87491.0 |        0.0 |         0.0 |       0.0 |      0.0 |          0.0
1756711950.0 | 1542538.0 |      4.0 |  0.09 |  0.13 |      0.22 | 87462.0 |        0.0 |         0.0 |       0.0 |      0.0 |          0.0
1756711951.0 | 1542538.0 |      4.0 |  0.02 |  0.06 |      0.08 | 99156.0 |        0.0 |         0.0 |       0.0 |      0.0 |          0.0
1756711952.0 | 1542538.0 |      4.0 |  0.06 |  0.13 |      0.19 | 99163.0 |        0.0 |         0.0 |       0.0 |      0.0 |          0.0
1756711953.0 | 1542538.0 |      4.0 |  0.04 |   0.1 |      0.14 | 99198.0 |        0.0 |         0.0 |       0.0 |      0.0 |          0.0
1756711954.0 | 1542538.0 |      4.0 |  0.04 |  0.09 |      0.13 | 98916.0 |        0.0 |         0.0 |       0.0 |      0.0 |          0.0
1756711955.0 | 1542538.0 |      4.0 |  0.04 |  0.12 |      0.16 | 99333.0 |        0.0 |         0.0 |       0.0 |      0.0 |          0.0
...>>> ResourceTracker.get_combined_metrics
>>> from rich import print as pp
>>> pp(tracker.get_combined_metrics(human_names=True)[0])
{
    'Timestamp': 1756711946.0,
    'System processes': 720.0,
    'System CPU time (user)': 0.62,
    'System CPU time (system)': 0.41,
    'System CPU usage': 1.0303,
    'System free memory': 18888932.0,
    'System used memory': 38098620.0,
    'System memory buffers': 3612.0,
    'System memory page/file cached': 8555708.0,
    'System active memory': 25858216.0,
    'System inactive memory': 110860.0,
    'System disk read': 872448.0,
    'System disk write': 274432.0,
    'System disk space total': 3699.99,
    'System disk space used': 2600.86,
    'System disk space free': 1099.13,
    'System inbound network traffic': 4627.0,
    'System outbound network traffic': 3251.0,
    'System GPU usage': 0.19,
    'System VRAM used': 1610.0,
    'System GPUs in use': 1.0,
    'Process PID': 1542538.0,
    'Process children': 4.0,
    'Process CPU time (user)': 0.07,
    'Process CPU time (system)': 0.08,
    'Process CPU usage': 0.15,
    'Process memory usage': 84612.0,
    'Process disk read': 0.0,
    'Process disk write': 0.0,
    'Process GPU usage': 0.0,
    'Process VRAM used': 0.0,
    'Process GPUs in use': 0.0
}
>>> ResourceTracker.stats
>>> pp(tracker.stats())
defaultdict(<class 'dict'>, {
    'process_cpu_usage':
      {'mean': 0.14,
       'max': 0.26},
    'process_memory':
      {'mean': 94373.43,
       'max': 109308.0},
    'process_gpu_usage':
      {'mean': 0.0,
       'max': 0.0},
    'process_gpu_vram':
      {'mean': 0.0,
       'max': 0.0},
    'process_gpu_utilized':
      {'mean': 0.0,
       'max': 0.0},
    'system_disk_space_used_gb':
      {'max': 2600.87},
    'system_net_recv_bytes':
      {'sum': 111299615.0},
    'system_net_sent_bytes':
      {'sum': 103073415.0},
    'timestamp': {'duration': 221.0}
})![]()
>>> ResourceTracker.recommendations
Super simple algorithm:
cpu: average CPU usage of the process(es)memory: maximum memory usage of the process(es) with a 20% buffergpu: maximum number of GPUs used by the process(es)vram: maximum VRAM usage of the process(es) with a 20% buffer
>>> ResourceTracker.recommendations
>>> print(ResourceTracker.recommend_resources.__doc__)
Recommend optimal resource allocation based on the measured resource tracker data.

The recommended resources are based on the following rules:

- target average CPU usage of the process(es)
- target maximum memory usage of the process(es) with a 20% buffer
- target maximum number of GPUs used by the process(es)
- target maximum VRAM usage of the process(es) with a 20% buffer

Args:
    historical_stats: Optional list of historical statistics (as returned by [resource_tracker.ResourceTracker.stats][])
                      to consider when making recommendations. These will be combined with the current stats.

Returns:
    A dictionary containing the recommended resources (cpu, memory, gpu, vram).
>>> ResourceTracker.recommendations
>>> pp(tracker.recommend_server())
{
    'vendor_id': 'aws',
    'server_id': 't4g.nano',
    'name': 't4g.nano',
    'api_reference': 't4g.nano',
    'display_name': 't4g.nano',
    'description': 'Burstable performance [AWS Graviton processors] Gen4 nano',
    'family': 't4g',
    'vcpus': 2,
    'hypervisor': 'nitro',
    'cpu_allocation': 'Burstable',
    'cpu_cores': 2,
    'cpu_speed': 2.5,
    'cpu_architecture': 'arm64',
    'cpu_manufacturer': 'AWS',
    'cpu_family': 'ARMv8',
    'cpu_model': 'Neoverse-N1',
    'cpu_l1_cache': 262144,
    'cpu_l2_cache': 2097152,
    'cpu_l3_cache': 33554432,
    'cpu_flags': ['fp', 'asimd', 'evtstrm', 'aes', 'pmull', 'sha1', 'sha2', 'crc32', 'atomics', 'fphp', 'asimdhp', 'cpuid', 'asimdrdm', 'lrcpc', 'dcpop', 'asimddp', 'ssbs'],
    'cpus': [],
    'memory_amount': 512,
    'memory_generation': None,
    'memory_speed': None,
    'memory_ecc': None,
    'gpu_count': 0,
    'gpu_memory_min': None,
    'gpu_memory_total': None,
    'gpu_manufacturer': None,
    'gpu_family': None,
    'gpu_model': None,
    'gpus': [],
    'storage_size': 0,
    'storage_type': None,
    'storages': [],
    'network_speed': 0.032,
    'inbound_traffic': 0.0,
    'outbound_traffic': 0.0,
    'ipv4': 0,
    'status': 'active',
    'observed_at': '2025-09-01T18:34:34.309153',
    'score': 3000.57,
    'price': 0.0003,
    'min_price': 0.0003,
    'min_price_spot': 0.0003,
    'min_price_ondemand': 0.0028,
    'score_per_price': 10001900.0,
    'selected_benchmark_score': None,
    'selected_benchmark_score_per_price': None,
    'vendor': {
        'vendor_id': 'aws',
        'status': 'active',
        'country_id': 'US',
        'state': 'Washington',
        'observed_at': '2025-09-01T18:59:50.235097',
        'name': 'Amazon Web Services',
        'city': 'Seattle',
        'address_line': '410 Terry Ave N',
        'logo': 'https://sparecores.com/assets/images/vendors/aws.svg',
        'zip_code': '98109',
        'homepage': 'https://aws.amazon.com',
        'founding_year': 2002,
        'status_page': 'https://health.aws.amazon.com/health/status'
    }
}
Super simple algorithm: cheapest server w/ rec resources.
>>> print(ResourceTracker.__doc__)
![]()
$ todo.sh listall +resource-tracker
- Stream resource usage data to a central location
- Tweak resource recommender algorithm?
- Configure the server recommender algorithm!
- Limit to vendor, region, compliance framework etc.
- Prioritize for cost efficiency instead of cheapest
- Find related benchmarks
- Change-detection for resource usage
- …
- Framework integrations!
>>> from metaflow import track_resources
from metaflow import Flow, FlowSpec, step, track_resources
class ResourceTrackingFlow(FlowSpec):
@step
def start(self):
print("Starting step")
self.next(self.my_sleeping_data)
@track_resources
@step
def my_sleeping_data(self):
data = bytearray(500 * 1024 * 1024) # 500MB
sleep(3)
self.next(self.end)
@step
def end(self):
print("Step finished")
pass
if __name__ == "__main__":
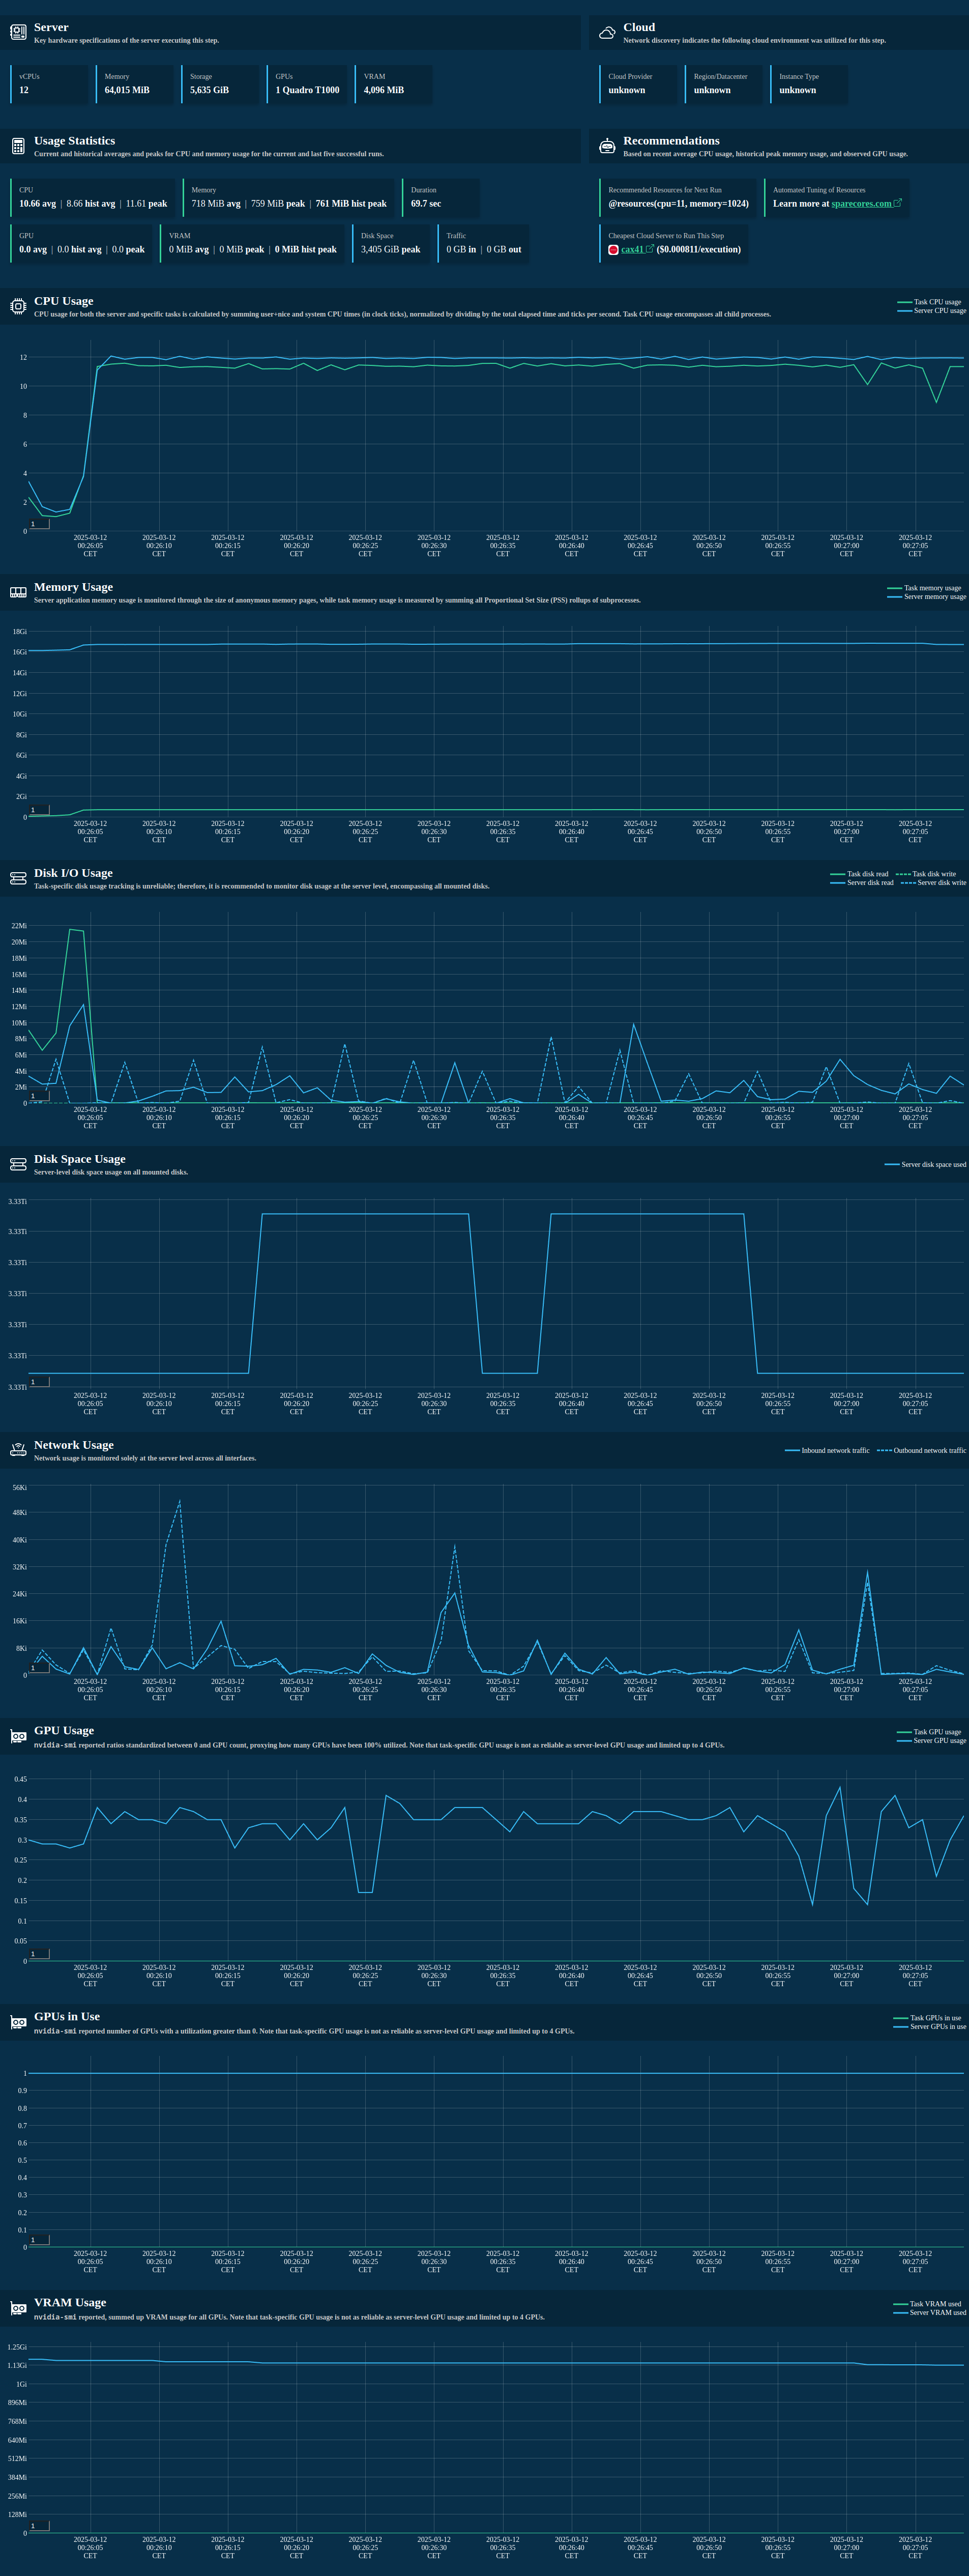
ResourceTrackingFlow()>>> from metaflow import track_resources
@track_resources decorator starts ResourceTracker to:
- Look up hardware specs and environment information
- Discover the cloud provider, region and instance type
- Track CPU, memory, disk I/O and storage, network, GPU/VRAM, and more
- Generate summary statistics
- Recommend optimal resource allocations for the step
- Recommend the cheapest cloud server type for future runs
- Present all this in an auto-generated card attached 😊
>>> from metaflow import track_resources
>>> from metaflow import track_resources
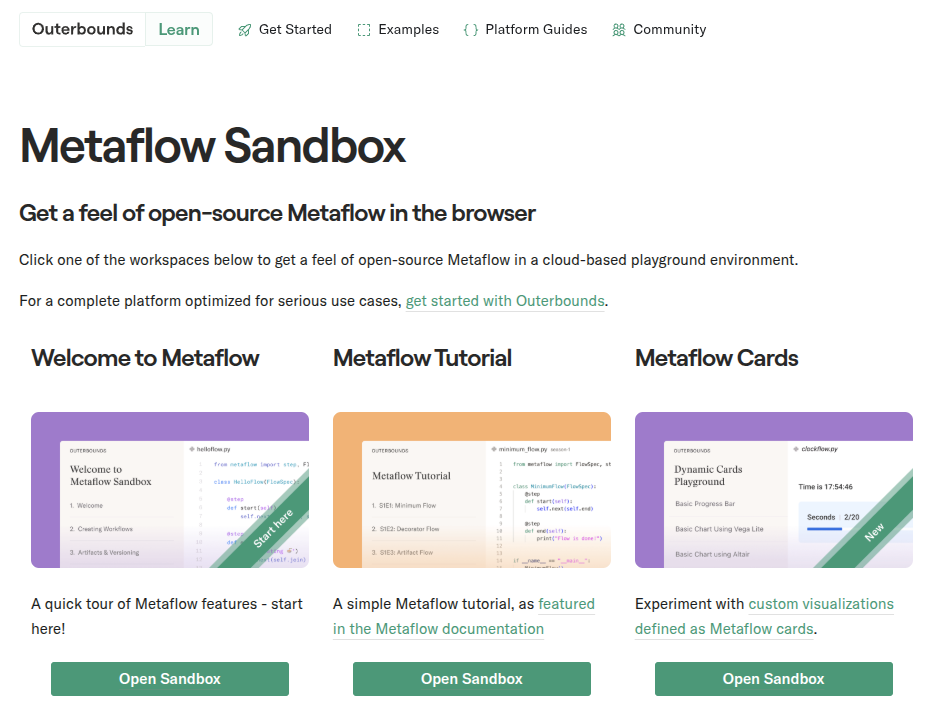
Source: Outerbounds sandbox
>>> inspect.getsource(track_resources)
- Historical data: fetch
resource_usageartifacts from up-to 5 recent successful runs.
- Generate card by default by injecting a decorator:
- Probably nicer ways to do this nowadays?
- Limitations: only runs at the end of a step, not real-time.
>>> import __future__
-
Automated
@resourcestuning (POC is ready) - Central usage data storage and dashboard (design ready)
- More granular resource mapping (e.g. VRAM) – Metaflow?
- Step optimization assistant (e.g. split step)
- Proactive resource management via SaaS add-on:
- Email alerts on overprovisioning
- Predict potential job failures due to insufficient resources
- Effortless remote execution (CaaS)
Thanks!
Slides: sparecores.com/talks