First of all, we admit that picking the right method, tool, and setting up a reproducible, authentic environment to evaluate the performance of a cloud server (sometimes with variable/shared resources) is hard, if not impossible. However, acknowledging the known limitations, benchmark scores can still often be very helpful in making decisions, such as selecting the instance type for a specific task. Now let's suppose a spherical server in vacuum 😊
All benchmarks are wrong, but some are useful. . .
— Paraphrased after George E. P. Box.
We wanted to provide a good variety of benchmarks right from the beginning of the project, as we are very well aware that there are many different use-cases, e.g.
- Lightweight compute VS full load on all available CPU cores,
- Hyper-threading helping or hurting the performance of an application,
- No disk usage VS large and fast storage required,
- Heavy network traffic,
- Use of GPUs, TPUs etc.
Geekbench 6 #
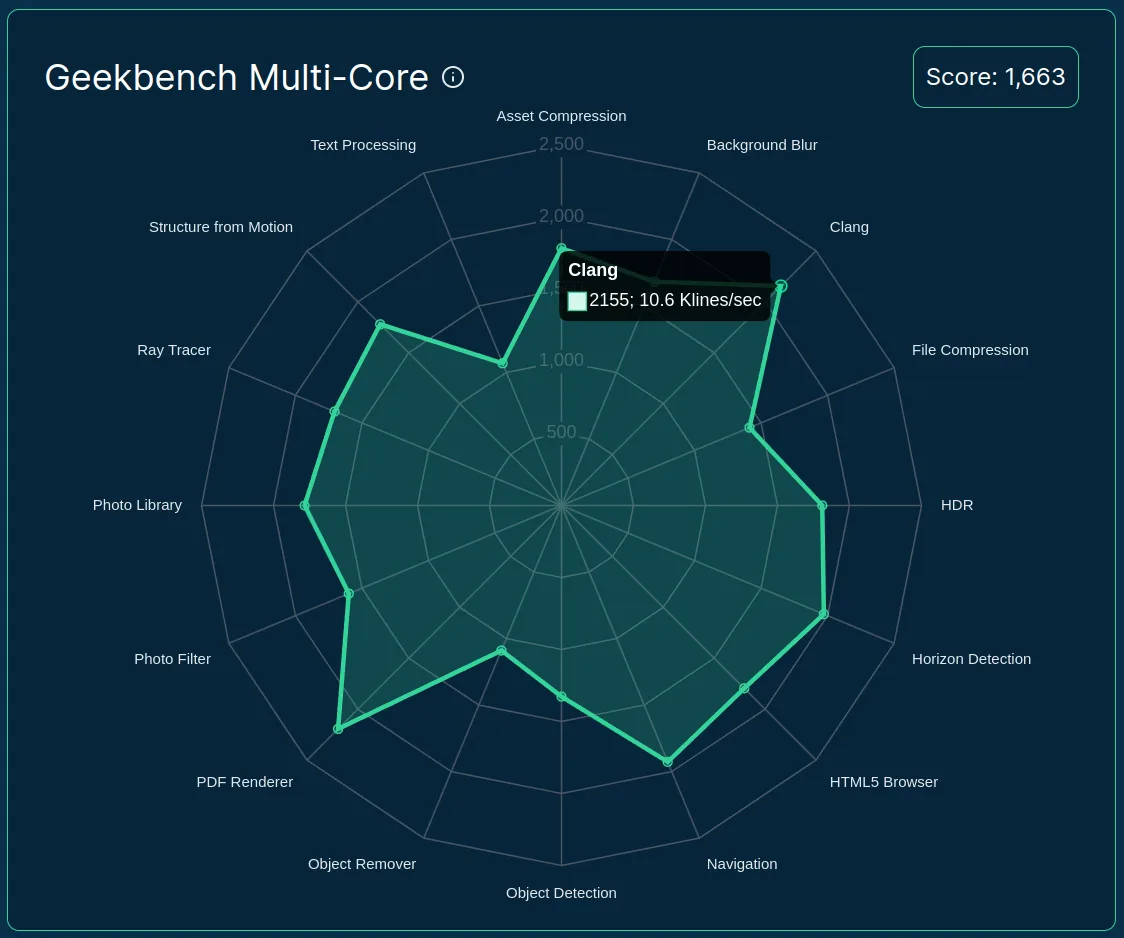
So first, we looked at existing solutions and frameworks. Despite being proprietary, we decided to go with GeekBench due to its ease of deployment, variety of benchmark workloads, and support for ARM machines as well. Later, we learned the hard way that the latter is experimental, and cannot be used with the paid license for automated runs, so we had to write an HTML parser to store the results. Nevertheless, it was indeed relatively easy to deploy and run, and measures the performance of many use cases:
- File Compression: Compresses and decompresses the Ruby 3.1.2 source archive (a 75 MB archive with 9841 files) using LZ4 and ZSTD on an in-memory encrypted file system. It also verifies the files using SHA1.
- Navigation: Generates 24 different routes between a sequence of locations on two OpenStreetMap maps (one for a small city, one for a large city) using Dijkstra's algorithm.
- HTML5 Browser: Opens and renders web pages (8 in single-core mode, 32 in multi-core mode) using a headless web browser.
- PDF Renderer: Opens complex PDF documents (4 in single-core mode, 16 in multi-core mode) of park maps from the American National Park Service (sizes from 897 KB to 1.5 MB) with large vector images, lines and text.
- Photo Library: Categorizes and tags photos (16 in single-core mode, 64 in multi-core mode) based on the objects that they contain. The workload performs JPEG decompression, thumbnail generation, image transformations, image classification (using MobileNet 1.0), and storing data in SQLite.
- Clang: Compiles files (8 in single-core mode, 96 in multi-core mode) of the Lua interpreter using Clang and the musl libc as the C standard library for the compiled files.
- Text Processing: Loads 190 markdown files, parses the contents using regular expressions, stores metadata in a SQLite database, and exports the content to a different format on an in-memory encrypted file system, using a mix of C++ and Python.
- Asset Compression: Compresses 16 texture images and geometry files using ASTC, BC7, DXTC, and Draco.
- Object Detection: Detects and classifies objects in 300x300 pixel photos (16 in single-core mode, 64 in multi-core mode) using the MobileNet v1 SSD convolutional neural network.
- Background Blur: Separates and nlurs the background of 10 frames in a 1080p video, using DeepLabV3+.
- Horizon Detection: Detects and straightens uneven or crooked horizon lines in a 48MP photo to make it look more realistic, using the Canny edge detector and the Hough transform.
- Object Remover: Removes an object (using a mask) from a 3MP photo, and fills in the gap left behind using the iterative PatchMatch Inpainting approach (Barnes et al. 2009).
- HDR: Blends six 16MP SDR photos to create a single HDR photo, using a recovery process and radiance map construction (Debevec and Malik 1997), and a tone mapping algorithm (Reinhard and Devlin 2005).
- Photo Filter: Applies color and blur filters, level adjustments, cropping, scaling, and image compositing filters to 10 photos range in size from 3 MP to 15 MP.
- Ray Tracer: Renders the Blender BMW scene using a custom ray tracer built with the Intel Embree ray tracing library.
- Structure from Motion: Generates 3D geometry by constructing the coordinates of the points that are visible in nine 2D images of the same scene.
All these workloads are run in a single-core and multi-core settings as well, and besides providing the actual value (e.g. the number of photos processed per minute). The main scores are relative compared to the performance of a Dell laptop (2500 score in all workloads).
There's also a global Single-core and Multi-core value, that are composite scores using the weighted arithmetic mean of the single-core or multi-core subsection scores, computed using the geometric mean of the underlying standardized workload scores.
Here's a quick preview of the 16+1 single-core scores presented in our server details pages, which is also available in our public datasets:

GeekBench 6 scores of a t4g.large server at AWS
(data collected an visualized by Spare Cores)
Compression Algorithms #
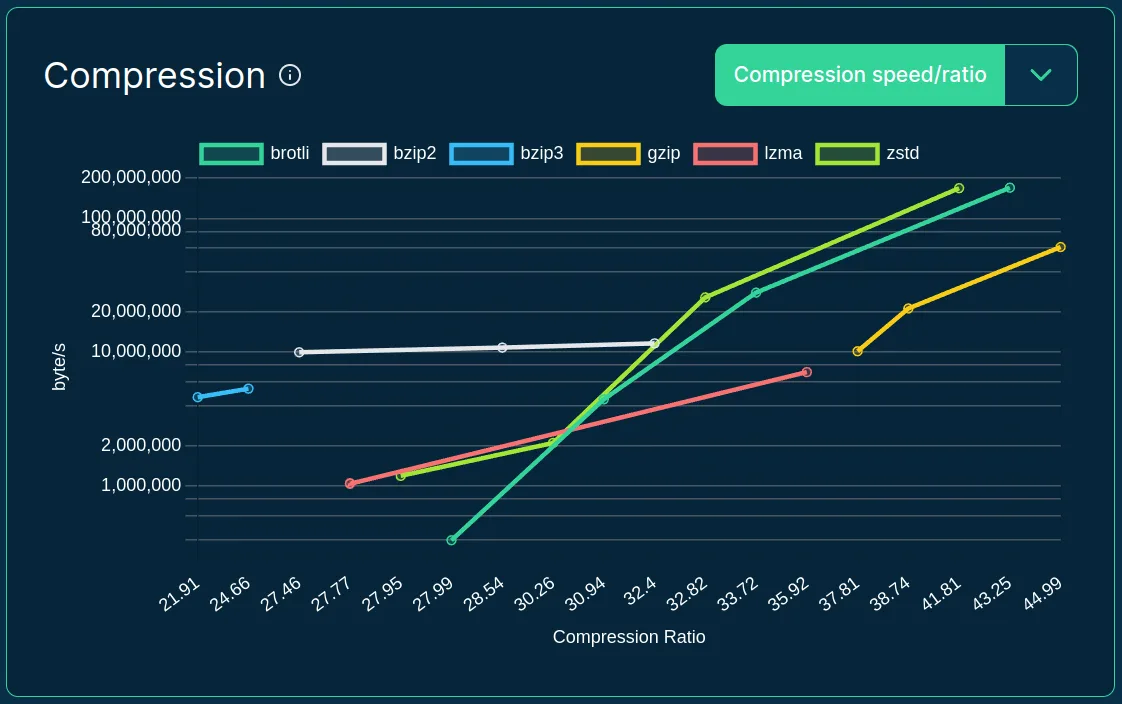
Although Geekbench already provides a File Compression workload, it's limited to two algorithms and does not provide detailed information, only a combined score. So, we decided to benchmark six compression algorithms using different configurations (e.g. compression level, number of threads, and block size) on the Silesia corpus (10 MB uncompressed) to measure the speed of compression and decompression, and also recording the compression ratio.
This resulted in 75 metrics for each server, which can be useful to decide which algo and actual configuration might be optimal on an instance e.g. for the fastest compression/decompression while achieving a compression ratio.
All these values visualized on a joint line chart on our homepage:

The compressions speed as a function of the compression ratio using multiple compression algos on a t4g.large server at AWS
(data collected an visualized by Spare Cores)
Memory Bandwidth #
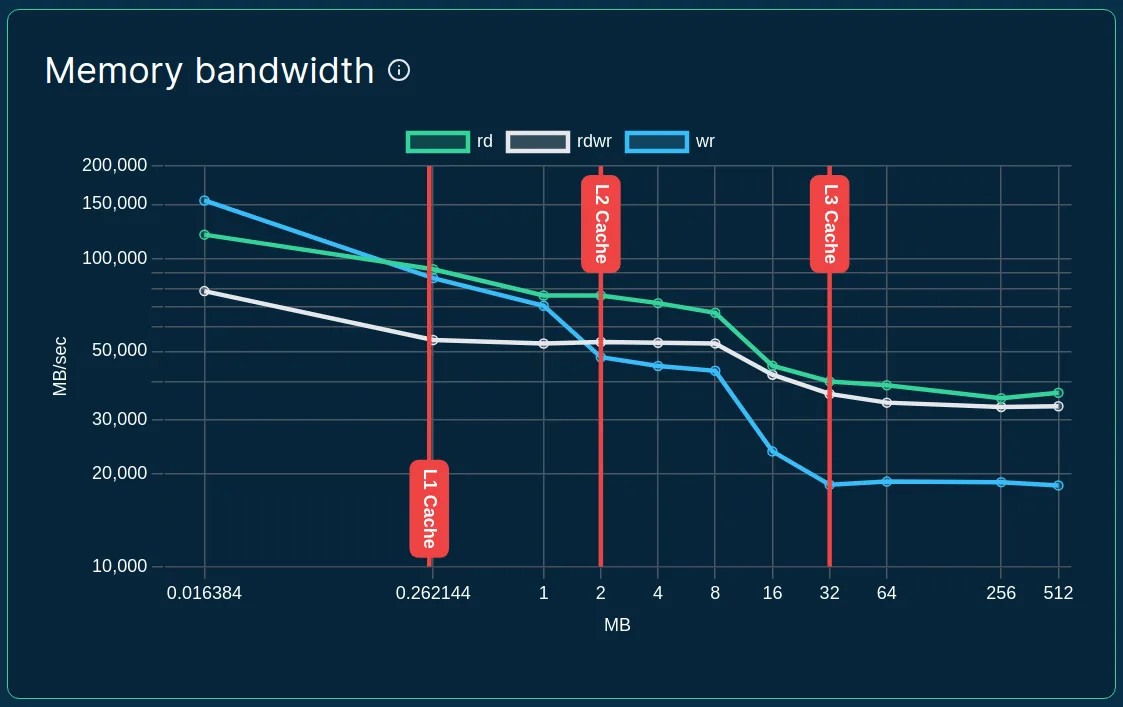
We are also interested in measuring the performance of the read, write
and mixed memory operations using different block sizes, so we
iteratively run bw_mem from the LMBench suite:

The compressions speed as a function of the compression ratio using multiple compression algos on a t4g.large server at AWS
(data collected an visualized by Spare Cores)
As you can see, we also added the L1/L2/L3 cache amounts to the chart, as being highly relevant to the memory workload performance. Note that depending on the actual CPU implementation, the cache amounts might be shared across cores, so on a server with 32 MB L3 cache and 8 cores, in most cases only 4 MB of L3 cache is available to a single core application.
OpenSSL Speed #
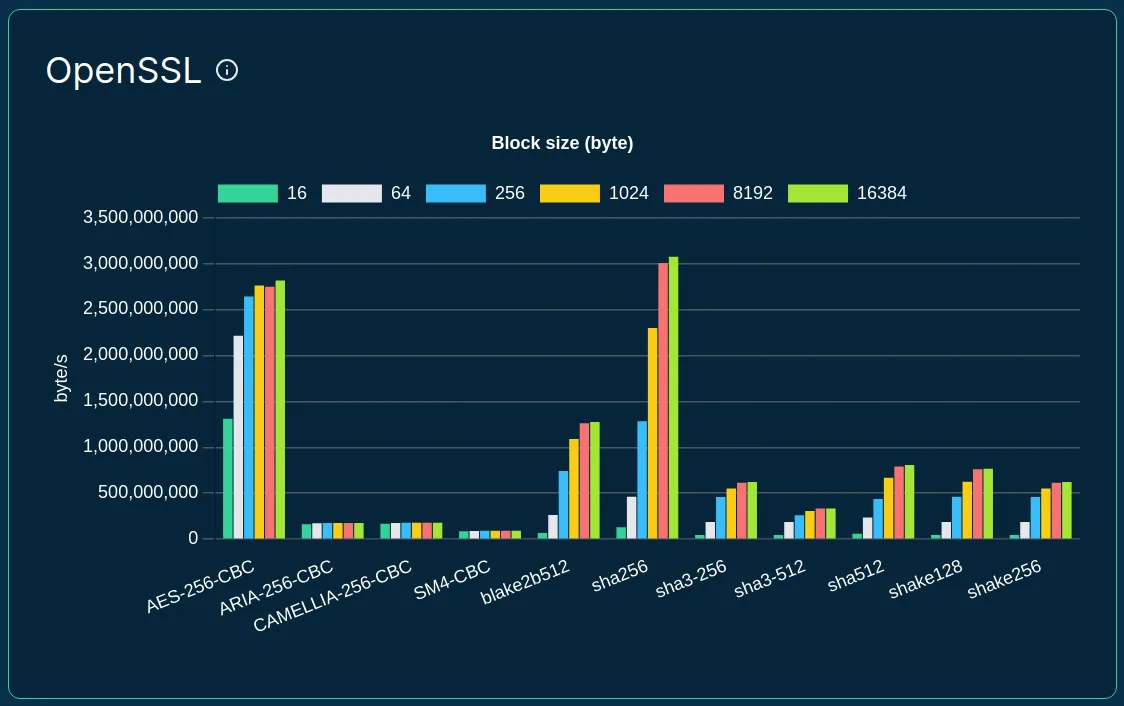
To check the cryptography performance of the servers, we selected some of OpenSSL's hash functions and block ciphers and run those with different block sizes of data:

The speed of hash functions and block ciphers on t4g.large
(data collected an visualized by Spare Cores)
One SCore to Rule Them All #
Overall, we measure more than 200 performance scores for each server:
- 34 records from Geekbench 6 (16-16 single-core and multi-core scores + 1-1 composite scores),
- 75 records on the compression algos (6 compression algos with different compression levels, threads and block sizes),
- 33 records from
bw_mem(11 block sizes for each operation type), - 66 records on OpenSSL (7 hash functions and 4 block ciphers with 6 block sizes),
- 1 record on BogoMips as reported by the Linux kernel.
Hopefully, everyone can find a relevant metric for their use case from the above list ... but what if you want a single measurement to show the general performance of the CPU?
We have found stress-ng a fantastic tool to put full load on a
system, and although it's explicitly stated not to be a benchmarking
tool, it does results in meaningful and useful metrics with the right
selection of the CPU stress method.
After evaluating approximately 50 CPU stress methods, we have found that many returns diluted scores when running on hyper-threaded (HT) cores, so we looked for methods that measure the actual raw multi-core performance of the CPU, and identified the two finalists below.:
jmp: Simple unoptimised compare >, <, == and jmp branching.div16: 50,000 16 bit unsigned integer divisions.
Both are doing relatively simple tasks, in simpler terms:
jmpperforms a large number of comparisons and conditional jumps without allowing the compiler to optimize away these tasks,div16performs a lot of integer divisions.
The latter is pretty straightforward to grasp even for someone like me
with a degree from the Arts Faculty 😅 . . . so we decided to go with div16.
Actually, it scales so well with the number of physical CPU cores, that we decided to make it the main metric to show for all nodes. You can find it under the "SCore" name, which is a shorthand for "Spare Cores Score" (that we found problematic to pronounce, especially when you want to distinguish between the "Single-core Spare Cores Score" and the "Multi-Score Spare Cores Score 🤯).
Orchestrating performance evaluations #
If you are interested in the details of starting the cloud instances
and running the benchmarks, please check out the Runner and
Inspector components of the Spare Cores ecosystem.
Both the development and the actual runs happen in public: you can find the repositories on GitHub, and all the steps of starting, evaluating, cleaning up the servers are managed through GitHub Actions.
As always, we appreciate any feedback or any kind of contributions 🙇
Future plans #
Although you can already find the above performance metrics in our
public database dumps and our homepage (see
e.g. t4g.large) for most servers, there are
a few servers that we were unable to start yet due to capacity
quotas at some vendors. We also plan to add support for more vendors.
We are also thinking about new benchmark workloads, e.g. currently
working on evaluating different implementations of GBMs (Gradient
Boosting Machine) on different data sizes, running on CPUs and GPUs as
well — potentially building on Szilard Pafka's awesome
benchm-ml or
gbm-perf.
If you have other suggestions, please get in touch!
