
Spare Cores has added a new database benchmark and we’re excited to bring you some early results! We can now measure server performance on PostgreSQL workloads across our full range of monitored servers and we have extended our coverage to include managed PostgreSQL servers at several vendors. The new benchmark consists of a demanding read-only transaction containing subqueries hitting the core PostgreSQL functionality (joins, aggregations, indexes, hashes, The Oversized-Attribute Storage Technique (TOAST), text search, and much more). The workload is run at four levels of concurrency and the resulting metric is the maximum transactions per minute (TPM) achieved by each server across any concurrency condition. You can check out the details in our benchmark introduction here: Measuring PostgreSQL Performance at Scale.
Since this benchmark is also one of our first tests of high-concurrency workloads, we wanted our initial look to span the breadth of compute sizes. Given our recent work profiling the AWS Graviton 5-powered families, which includes servers ranging from 1 vCPU (4 GiB RAM) up to 192 vCPUs (and 768 GiB RAM), these felt like a natural choice. Our earlier analysis (which you can review here: AWS Graviton5 Benchmarks) considered the m9g and m9gd, which have substantially larger L3 memory caches than previous generations. Our tests showed corresponding improvements in memory bandwidth performance for read, write, and mixed operations. These benefits carried over to computing tasks (such as compression, sorting, and mathematical operations), where we saw a 16-50% boost in performance, and to LLM inference where we saw a roughly 30% boost in performance across the board for Gemma (a 2B parameter LLM). Now we are extending these results to include our new high concurrency database benchmarks!
Benchmark Results #
Cutting to the chase, we ran the PostgreSQL benchmark on all of the available Graviton machines in addition to their corresponding Amazon-managed RDS instances. As shown in the figure below, the performance followed a similar pattern to our earlier-reported results with TPM increasing with successive generations. Interestingly, we also saw a 3.7%-15.7% boost in TPM for the Amazon-managed RDS instances over the database running on the equivalent EC2 instances (tuned via industry standard methodology).
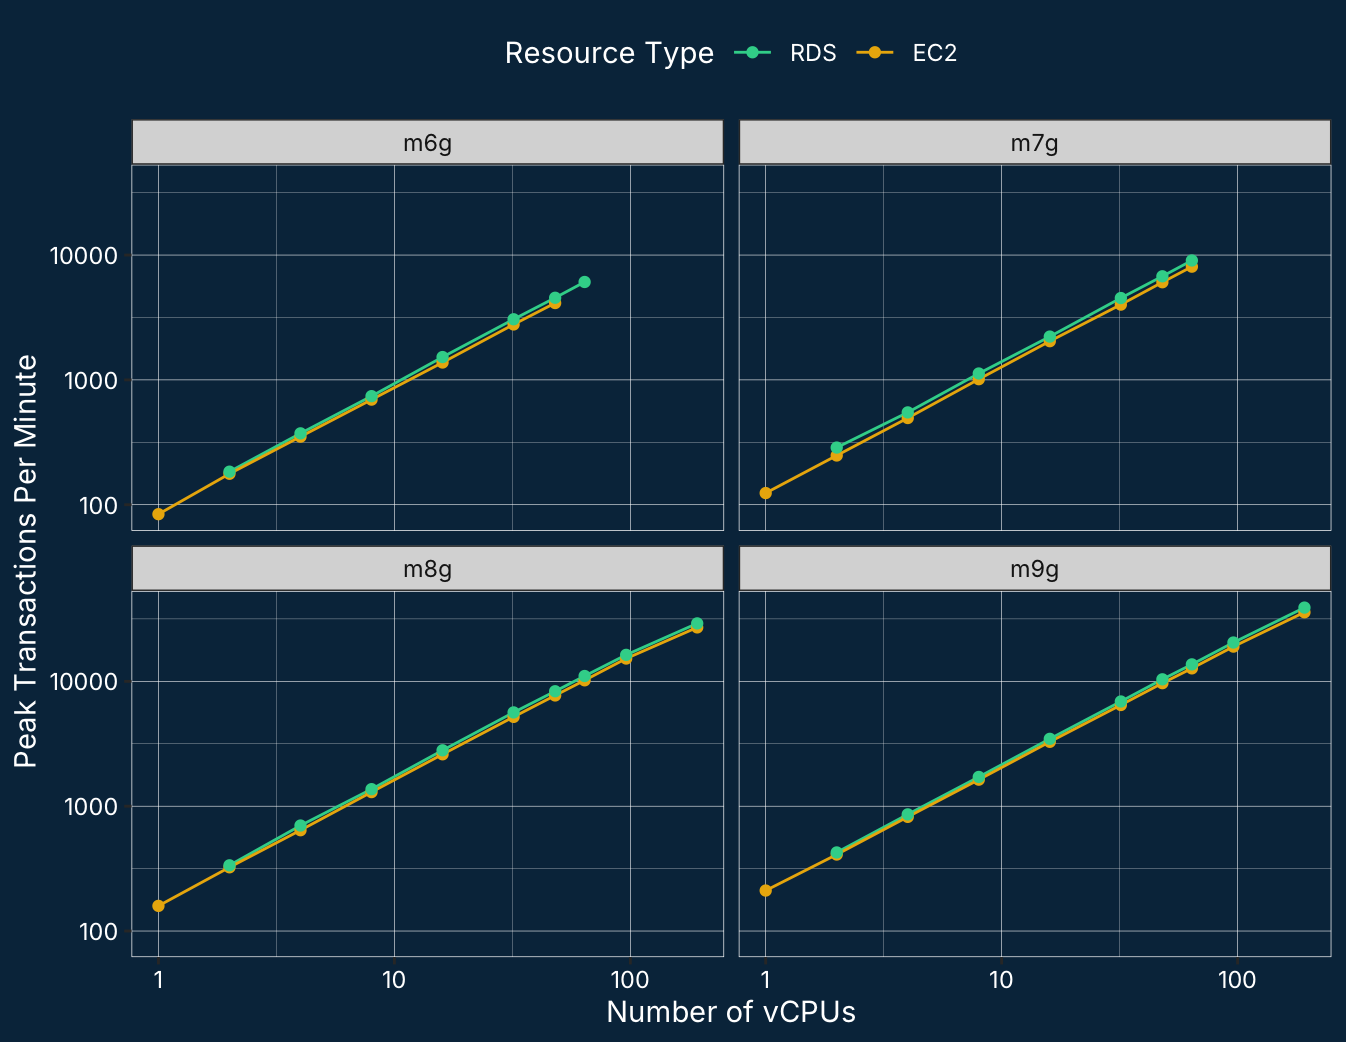
PostgreSQL TPM for EC2 vs RDS running on Graviton families m6g - m9g.
When we consider this data on a per-vCPU basis (shown below), it’s a bit easier to see that
- the overall performance improves across the Graviton generations,
- the performance scales nearly linearly (at first) with the vCPU count before dipping a bit for the ultra-large instances, and
- the performance boost of RDS over the generic self-managed databases running on EC2.
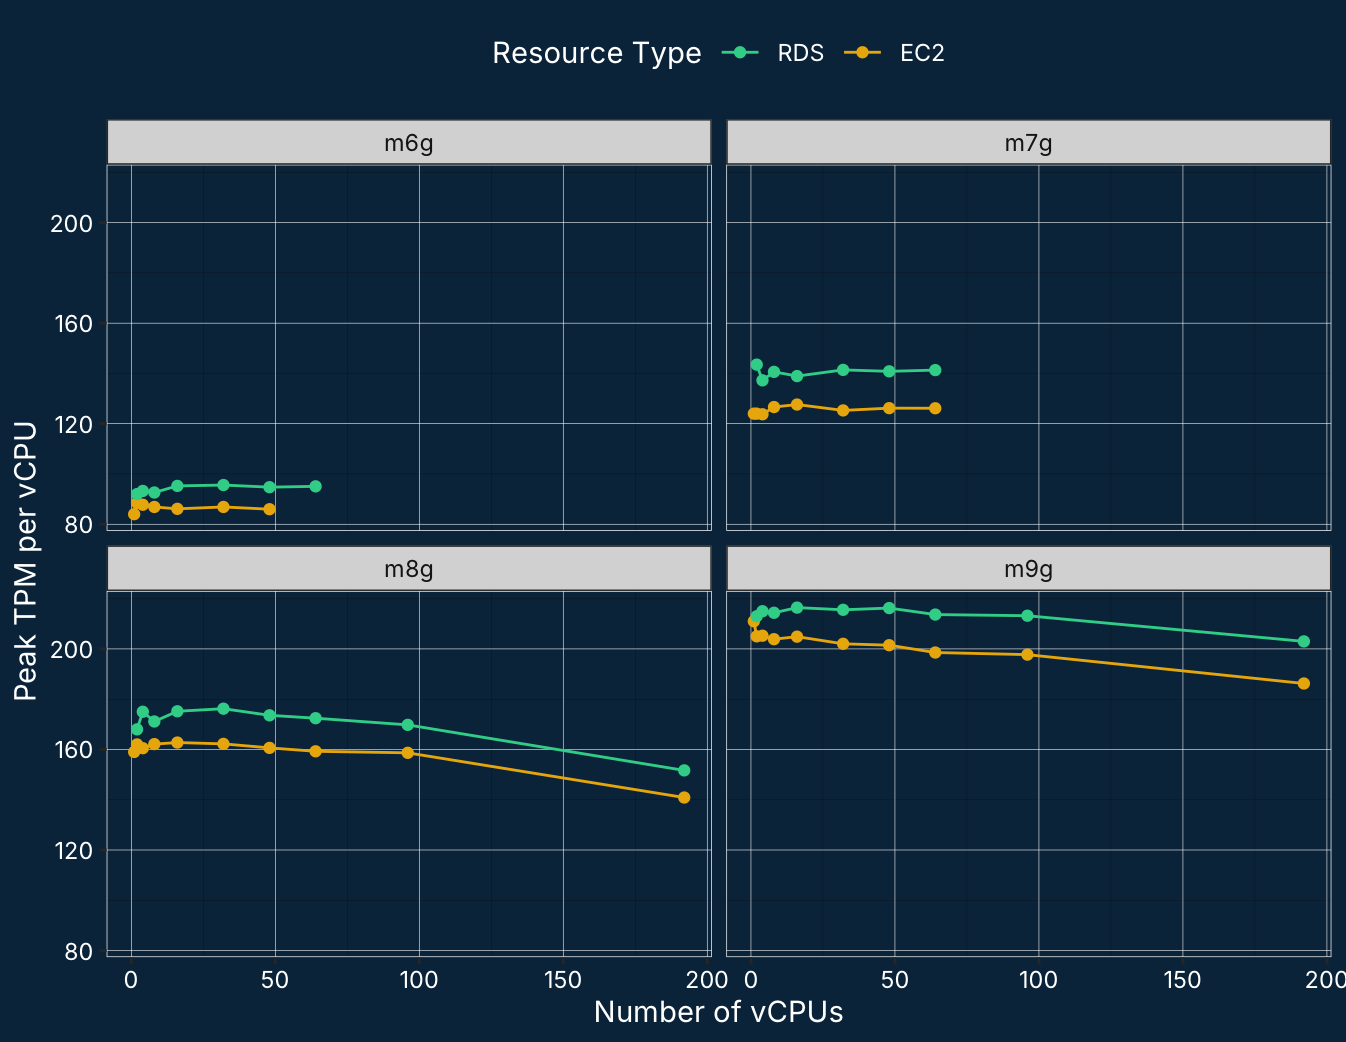
PostgreSQL TPM per vCPU for EC2 vs RDS running on Graviton families m6g - m9g.
And for those who would prefer to play in the raw numbers, here’s the same data in table form:
| instance type | EC2 TPM | RDS TPM | EC2 TPM/vCPU | RDS TPM/vCPU |
|---|---|---|---|---|
| m6g.medium | 84 | 84 | ||
| m6g.large | 177 | 184 | 88.5 | 92 |
| m6g.xlarge | 351 | 373 | 87.8 | 93.2 |
| m6g.2xlarge | 695 | 741 | 86.9 | 92.6 |
| m6g.4xlarge | 1378 | 1524 | 86.1 | 95.2 |
| m6g.8xlarge | 2780 | 3059 | 86.9 | 95.6 |
| m6g.12xlarge | 4127 | 4548 | 86 | 94.8 |
| m6g.16xlarge | 6085 | 95.1 | ||
| m6g.metal | 5540 | 86.6 | ||
| m7g.medium | 124 | 124 | ||
| m7g.large | 248 | 287 | 124 | 143.5 |
| m7g.xlarge | 495 | 549 | 123.8 | 137.2 |
| m7g.2xlarge | 1013 | 1125 | 126.6 | 140.6 |
| m7g.4xlarge | 2042 | 2223 | 127.6 | 138.9 |
| m7g.8xlarge | 4009 | 4525 | 125.3 | 141.4 |
| m7g.12xlarge | 6057 | 6760 | 126.2 | 140.8 |
| m7g.16xlarge | 8073 | 9045 | 126.1 | 141.3 |
| m7g.metal | 7998 | 125 | ||
| m8g.medium | 159 | 159 | ||
| m8g.large | 324 | 336 | 162 | 168 |
| m8g.xlarge | 642 | 700 | 160.5 | 175 |
| m8g.2xlarge | 1297 | 1369 | 162.1 | 171.1 |
| m8g.4xlarge | 2604 | 2803 | 162.8 | 175.2 |
| m8g.8xlarge | 5191 | 5639 | 162.2 | 176.2 |
| m8g.12xlarge | 7710 | 8332 | 160.6 | 173.6 |
| m8g.16xlarge | 10193 | 11036 | 159.3 | 172.4 |
| m8g.24xlarge | 15231 | 16299 | 158.7 | 169.8 |
| m8g.metal-24xl | 15270 | 159.1 | ||
| m8g.48xlarge | 27048 | 29121 | 140.9 | 151.7 |
| m8g.metal-48xl | 27151 | 141.4 | ||
| m9g.medium | 211 | 211 | ||
| m9g.large | 410 | 426 | 205 | 213 |
| m9g.xlarge | 821 | 860 | 205.2 | 215 |
| m9g.2xlarge | 1631 | 1715 | 203.9 | 214.4 |
| m9g.4xlarge | 3278 | 3463 | 204.9 | 216.4 |
| m9g.8xlarge | 6465 | 6898 | 202 | 215.6 |
| m9g.12xlarge | 9671 | 10380 | 201.5 | 216.2 |
| m9g.16xlarge | 12708 | 13675 | 198.6 | 213.7 |
| m9g.24xlarge | 18982 | 20468 | 197.7 | 213.2 |
| m9g.48xlarge | 35759 | 38974 | 186.2 | 203 |
| m9g.metal-48xl | 37080 | 193.1 |
Coming soon... #
We’ll be writing more on our database and other high-concurrency benchmarks soon. Here's a sneak peek at the performance patterns of matched-size machines running with and without Hyperthreading and/or Simultaneous Multithreading (SMT).
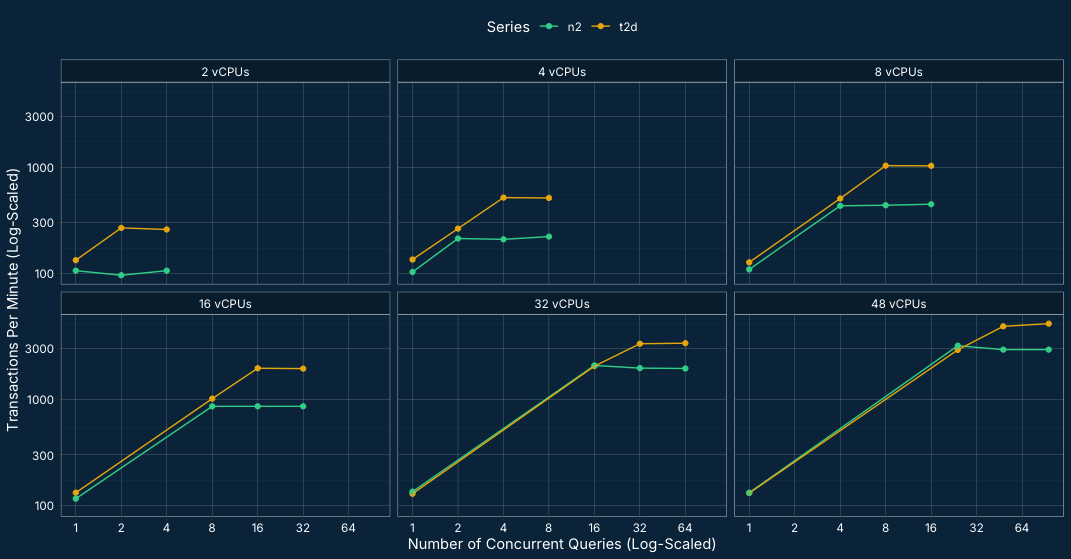
Database Benchmark Scores for GCP's N2 (with SMT) and T2D (no SMT) at Various Concurrency Levels.
Performance tends to peak or plateau when the number of concurrent processes is close to the number of physical cores. For machines without Hyperthreading/Simultaneous Multithreading (SMT) this is around the number of vCPUs (V), whereas for those with Hyperthreading/SMT it's closer to V/2. Interestingly, this is exactly what we see above when we compare GCP's N2 standard series (with Intel cores and Hyperthreading) and the T2D standard series (with AMD and no SMT) on our new high-concurrency database metric: The N2 plateaus around V/2 and the T2D at V.