
Earlier this year we published the Spare Cores Resource Tracker as a Python package, which monitors the CPU, memory, GPU, disk, and network usage of the host along with a process and its descendants -- then recommends the cheapest cloud server that meets those requirements. A natural next step for me was bringing the same functionality to the R ecosystem, which we did in time to debut it at the useR! 2025 conference in Durham, NC, as mentioned earlier this year.
Installation #
The package wraps the Python resource-tracker module via
reticulate,
so Python needs to be installed on the system to use the Resource Tracker.
First, install the Python dependency from R:
reticulate::py_install('resource-tracker')
Note that on macOS and Windows you also need psutil to be installed on the system,
as the Resource Tracker uses it to collect the resource usage data. On Linux with a modern
kernel, it is optional -- as the Resource Tracker can fall back to reading /proc directly.
Once the Python side is in order, install the most recent version of the R package from our GitHub repository:
remotes::install_github('SpareCores/resource-tracker', subdir = 'R')
Getting started #
Load the package and start the tracker -- it runs in the background without blocking your R session:
library(resource.tracker)
tracker <- ResourceTracker$new()
Do some work, then check the aggregated resource statistics at any time:
tracker$stats()
# List of 9
#  $ process_cpu_usage  :List of 2
#   ..$ mean: num 1.12
#   ..$ max : num 1.14
#  $ process_memory     :List of 2
#   ..$ mean: num 728783
#   ..$ max : num 798130
#  ...
Get a resource recommendation for the next run:
tracker$recommend_resources()
# List of 4
#  $ cpu   : int 1
#  $ memory: int 1024
#  $ gpu   : int 0
#  $ vram  : int 0
And then the actual server recommendation -- the cheapest cloud instance that fits those requirements, pulled live from the Spare Cores Navigator database:
tracker$recommend_server()
# List of 50
#  $ vendor_id  : chr "upcloud"
#  $ server_id  : chr "DEV-1xCPU-1GB-10GB"
#  $ vcpus      : int 1
#  $ memory_amount: int 1024
#  $ price      : num 0.0052
#  ...
Raw per-second samples are available as plain data.frame objects via
tracker$process_metrics, tracker$system_metrics, and
tracker$get_combined_metrics(), so you can do further analysis in R without
leaving your existing workflow.
Finally, generate an HTML report and open it in your browser:
report <- tracker$report()
report$browse()
An example report looks like this:
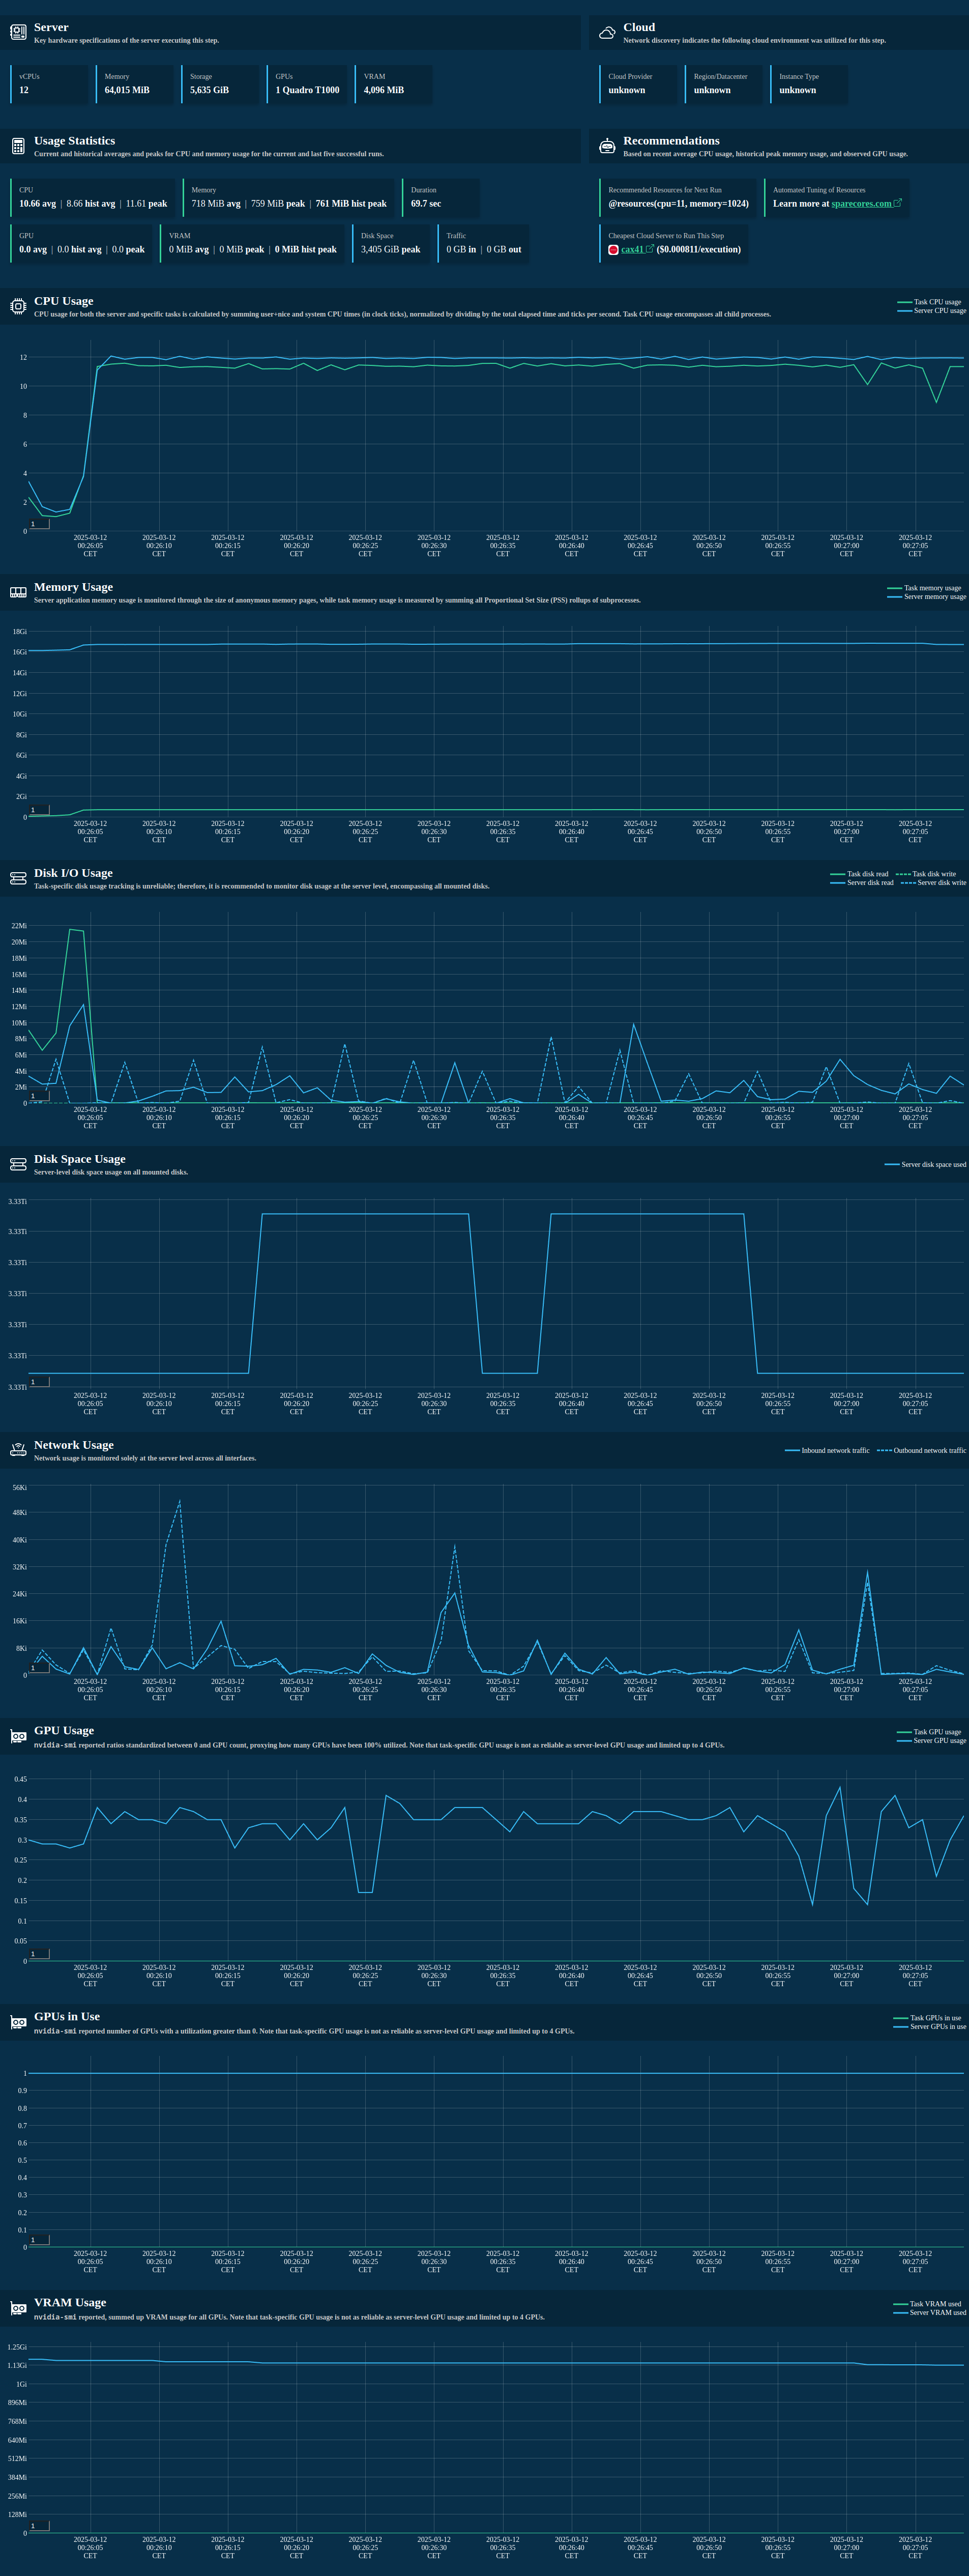
📔 For the full API reference, advanced usage, and an example report, see the R integration docs.
Why R? #
The short answer: R is the primary language for a large share of data scientists and statisticians, and there was no good way to monitor what their scripts actually consumed at the hardware level.
The slightly longer answer is personal: I have been maintaining R packages for
well over a decade, including the
logger
package (300+ GitHub stars and growing), also managed infrastructure for Data Science teams
using mixed-language workflows.
When we built the Python Resource Tracker, it was clear that R users should not have to drop into Python just to answer the question "how much RAM did that model training actually use, and what is the cheapest server I should run it on next time?" Now they do not have to.
Feedback #
If you run into issues, please open a ticket in our GitHub repository. And if you have ideas for further R integration (Shiny apps, R Markdown / Quarto reports, Plumber APIs), we'd love to hear from you in the comments below.