We recently received feedback on Twitter/X pointing out that comparing vCPUs across different instance generations doesn't make much sense:
And we completely agree! In fact, we never advocated for comparing servers purely based on their specs. Actually, that's why we have already covered 50+ benchmark scores for the monitored ~2000 servers, including a highlighted CPU burning score that is presented in our all our comparison tables, even in the screenshot above. However, the examples shared in the tweet inspired us to dig deeper:
I tested aws c5.large to c7i.large with redis, almost no gain and I tested skipper (http proxy for kubernetes ingress) with c6g.large compared to c7g.large -> 30% less cpu usage same work.
— Sandor Szücs (@sszuecs) on Aug 19, 2024
We will follow-up on the redis use-case, as we have several database-related benchmarks to be covered in our roadmap, but wanted to quickly react on the HTTP proxy workload.
TL;DR: We've benchmarked the above-mentioned (and 1000+ more)
instances for static web server performance using binserve and
wrk. Results show c7g.large offering up to a 100% performance
boost over c6g.large, with variations depending on file size and
number of connections. If you're not interested in the detailed
methodology and textual analysis, feel free to skip ahead and explore
the raw data directly at the related
server comparison page.
Static Web Serving #
Probably the most popular webserver and reverse proxy nowadays is
nginx, which is a fantastic tool with a lot of fancy features, but
provides mediocore performance with the default config, and
measurements highly depend on the actual configuration and
fine-tuning.
To simplify benchmarking, we chose
binserve,
a single-binary, very fast static web server written in Rust.
It scales surprisingly well without any tuning at all, so can probably
much better measure general static web serving capabilities of a
server compared to any much more complex nginx (or other)
configuration. It also stores the static files in memory, so the
overhead of filesystem/storage operations can be neglected.
HTTP Benchmarking #
To measure the performance of the web server, we decided to use
wrk,
which is a modern, multi-threaded HTTP benchmarking tool written in C.
We started wrk on the same server with binserve, and run it for
10-10 seconds using a matrix of different number of client threads (1,
2, 4) and open connections (1, 2, 4, 8, 16, 32) to query small (1 kb,
16 kb, 64 kb) to large files (256 kb, 512 kb) — as smaller file sizes
are likely to need more connections to saturate the machine.
Running both the web server and the HTTP benchmarking tool on the same server is questionable, as although it reduces the network overhead and constraints, but both tools compete for system resources, see e.g.:

This is quite heavy client-side usage! So running both the server and the client on the same node is definitely a tradeoff, but as doing this benchmark in the same way on all the other instances, we consider this a fair comparison.
We also recorded the server's and client's time spent executing in user/system mode, so we can use that ratio for extrapolating the expected server performance by trying to control for the client resource usage.
Last methodological note: we did not ingest the benchmark scores of
all individual runs, as e.g. the number of threads used by wrk is
not a meaningful technical detail when it comes to evaluating the
static webserver performance, so we simply picked the highest RPS
thread count among the same connection count and file size
combinations.
If you are interested in more details, I'd recommend checking the
actual benchmark script hosted in our benchmark-web Docker image
(benchmark.py) and the related ETL script
(inspect.py).
Results #
The original post mentioned ~30% diff between c6g.large and
c7g.large when testing skipper, so we were excited to check if we
have similar results:

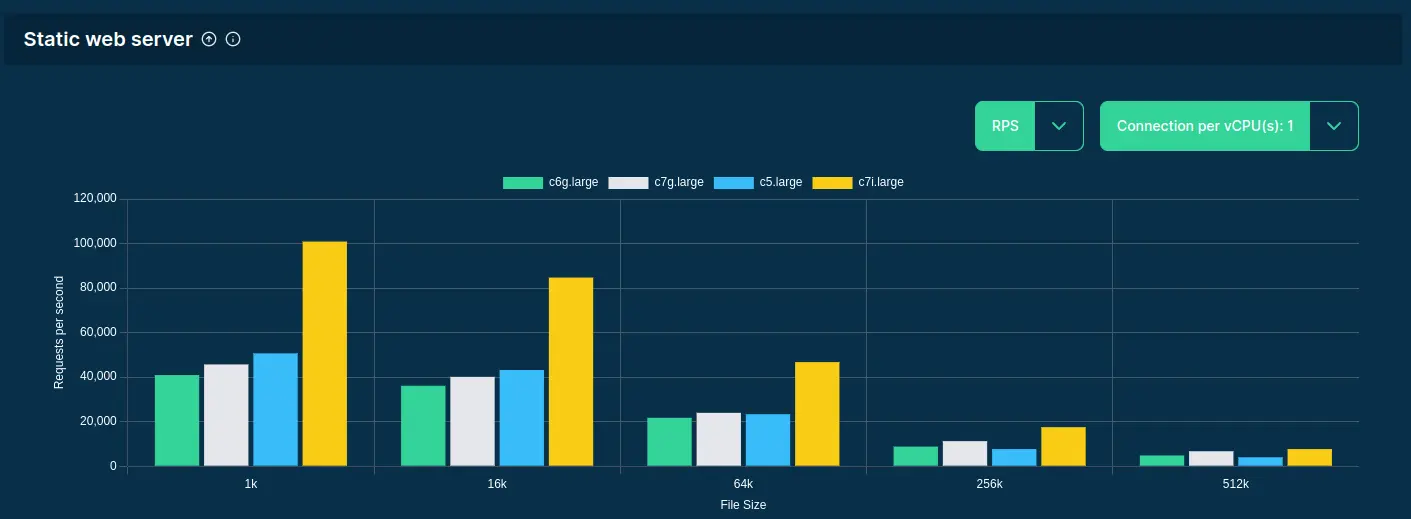
Performance of querying binserve on a single connection per vCPU
(data collected an visualized by Spare Cores)
Overall, c7g.large is definitely more powerful than c6g.large, but
the extra performance varies by a number of factors: for example, the
advantage is only around 12% (45.7k VS 40.9k RPS) when querying 1k
small files, while it's almost 40% (6.7k VS 4.8k) when serving much
larger, 512k files. Similarly, more open connections shows an ever
more drastic picture:

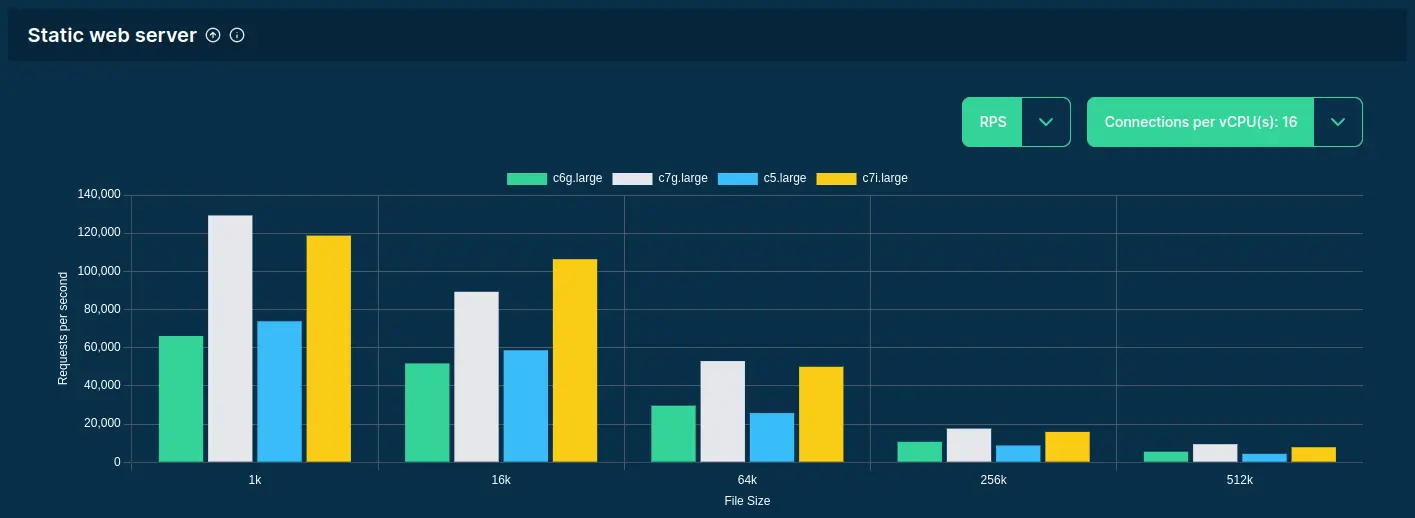
Performance of querying binserve on 16 connections per vCPU
(data collected an visualized by Spare Cores)
With small files and 16 open connections, c7g.large peaks at over
120k requests per second (note that 3x speed bump compared to the
above numbers): an almost 100% gain over c6g.large -- actually even
outperforming the c7i.large in this specific workload.
So depending on the size of data to be served and the number of concurrent connections, you might have better options either in the ARM or x86 instances.
Server Performance #
Again, the above RPS is not what you should expect from binserve
when running on the referenced server, since wrk consumed some of
the server's resources during the tests.
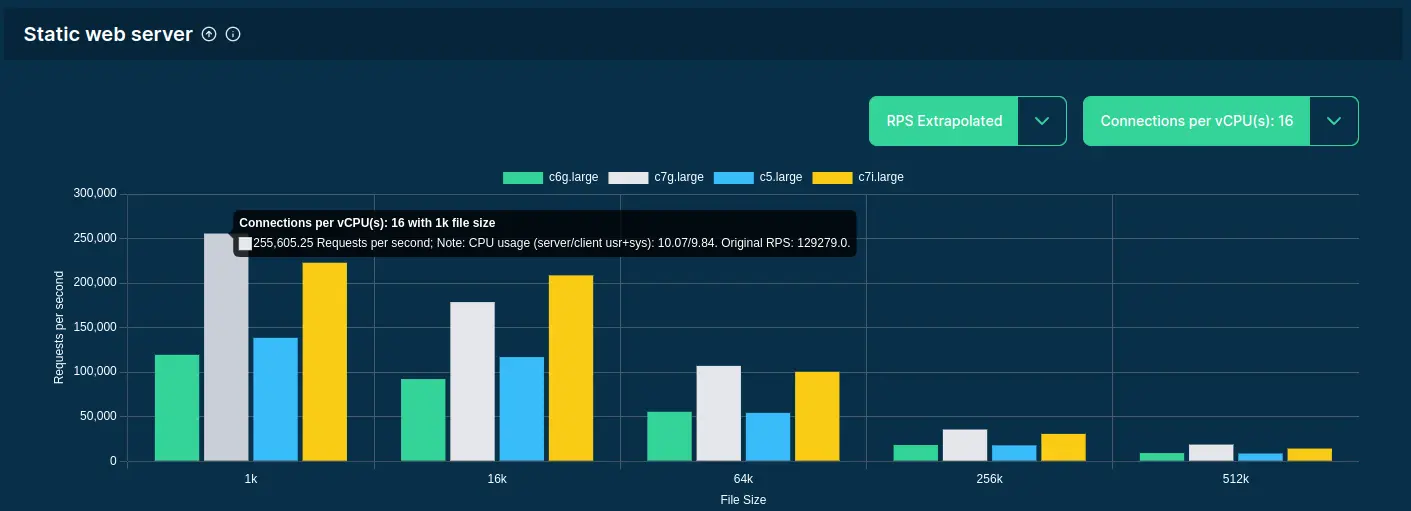
For this end, we estimated an expected server RPS by extrapolating the measured RPS by multiplying it with the ratio of the client's and server's time spent executing in user/system mode. In other (stats) terms, trying to control for the client resource usage:

Extrapolated server performance on 16 connections per vCPU
(data collected an visualized by Spare Cores)
Further Metrics #
For those more interested in throughput rather than the number of
requests per second, we have made both the raw and extrapolated values
in our server details and server comparison pages. We have also
recorded the average latency as reported by wrk, which might be
useful depending on your use case.
As always, you all the data we've collected is available in our
SQLite dumps and through sparecores-data Python package.
You can also browse the results directly on our homepage, e.g. by following
this direct link
to compare c6g.large, c7g.large, c5.large, and c7i.large at AWS.

