When you want to run something in the cloud, the question usually arises: exactly what kind of instances should you choose for the task? Some parameters are straightforward: we generally know how much memory is needed and what 1 GiB of memory means, just as network bandwidth and storage are quite precise—at least when it comes to their quantity. But what about the CPUs?
The main, universally provided information is the so-called vCPU count, meaning how many (virtual) CPU cores we can use. The complexity of the equation is compounded by the fact that the vCPU count—depending on the CPU type and settings—can include both actual (physical) and logical (e.g., Hyper-threading, HT, SMT) cores, which may or may not help with your workload, depending on the task.
Alright, we know how many (dedicated) vCPU cores we can use. With a bit of digging, we can usually find information on the underlying CPU, which we think will help us (since it's an off-the-shelf product with publicly available data), or we’re groping in the dark with a custom solution that only works with that provider (perhaps developed by them), giving us no chance of estimating what the CPU can really do.
If you're grappling with such dilemmas, you're in the right place: the Spare Cores project aims to answer questions like this.
What About Vertical Scalability? #
Great, you've figured out which machine to place your perfectly scalable application on, you launch it on a machine, it churns through data, working smoothly. But you need more. Since your application scales perfectly vertically (i.e., if it can process one unit of work on one CPU, it can process four units on four CPUs, and so on), and the pricing of providers is typically linear (twice as many vCPUs cost twice as much), your task is simply to increase the vCPU count of the underlying machine as your application’s CPU demand grows. (let's generously overlook the fact that there's a huge difference between vCPUs, which we also try to illustrate on the server listing and server comparison pages)
So if it managed one unit of work on 1 vCPU, will it handle 192 times as much on 192 vCPUs?
Well, no. Or yes? Actually, nobody knows for sure.
What causes this uncertainty? What determines whether your perfectly scalable application will indeed scale perfectly on the chosen cloud instance? Pretty much everything. In the worst case, even the weather!
Let’s try to go through these factors, intentionally leaving out many elements that are irrelevant to this article.
What Affects Scalability? #
Physical Factors #
Modern CPUs are smart; they won’t let themselves overheat. If they get too hot, they throttle their performance to protect themselves. Where does this affect you, you might ask, since the server you’re using is in the cloud. But the cloud just means “someone else’s computer.” Even though it’s intangible, it's ticking away in a data center somewhere, alongside thousands of others. And if these machines are really working, they generate a lot of heat, which must be dissipated—an expensive task, prompting data center operators to continuously seek ways to keep servers at an acceptable temperature as cheaply as possible.
Some providers’ machines may run hotter (perhaps because an air conditioner failed, raising the temperature by a few degrees), which means those machines will perform slower than identical counterparts elsewhere (or perhaps with a different provider).
Along with distant neighbors in the data center, nearby neighbors can also be problematic. If a machine has 32 cores, which the provider sells in 4 (v)CPU slices to different customers, and the other seven clients’ machines are idle, our machine has a higher chance of leveraging the CPU’s capabilities: the processor can run at a higher clock speed (boost), fitting within its power budget, and if the neighbors are similar, cooling may be less of an issue.
These variable parameters can manifest in inconsistent performance and imperfect scalability.
Beyond these environmental factors, we must consider the specific hardware architecture of the computer, the CPU and memory architecture, interconnect speeds, latency, topology, etc., which all influence whether your single-threaded/single-instance application will yield proportionately more performance when run in many threads/instances, matching the additional CPUs you put beneath it.
Software Environment #
In a cloud environment, providers generally sell you partitions from a larger machine, with this task managed by software (assisted by hardware, of course). Each provider uses different software with different configurations, leading to different outcomes. Some providers also sell metal machines, where this software (the hypervisor) is removed from the equation, so you don't have to bear the costs of virtualization.
Beyond the virtualization components, certain provider tasks (e.g., machine management, logging, performance data collection, etc.) may also take from the resources sold to you. These are typically very low-demand activities, but they still need to run somewhere, and if the provider sells 32 CPUs from a 32-CPU machine, it’ll happen at the expense of one of its customers, which manifests as performance variability.
What Does This Look Like in Reality? #
The Spare Cores project actually launches individual cloud instances to gather data on them. Of course, as explained above, this doesn’t guarantee that the data is universally valid; it’s just a snapshot of a given machine, possibly sitting in a hidden corner of some data center, waiting for your commands. Meanwhile, the outside world might be experiencing wild weather, with diesel generators compensating for a lost power input.
You can never know what your poor buddy is going through in reality.
Give it a pat at the end of each day if it’s done its job well!
What Should We Use for Measurement? #
The task is clear: we want to measure a machine’s scalability. Among the many options, which one should we choose?
We aim to include as many tools in our toolkit as possible, but for the most fundamental measurement of CPU scalability,
we use the CPU stress-testing component of stress-ng.
This program/test performs a very specific, simple operation and measures its operational speed, either in single or multiple instances. It’s straightforward, so memory bandwidth matters very little, allowing us to detect issues at the "foundational" level. If a simple CPU-burning application doesn’t scale well, it’s highly likely that a far more complex software won’t either (though, for such software, memory bandwidth may matter more, meaning a machine with lower scalability but higher memory bandwidth could perform better).
So, we’ve chosen a simple program. Let’s go ahead and measure across 1,813 cloud instances (as of the writing, that’s how many we could launch out of 2,084 across four providers—though the reasons for this could be a topic for another article)!
The Ancient #
We have our data, so let’s start by finding the oldest one!
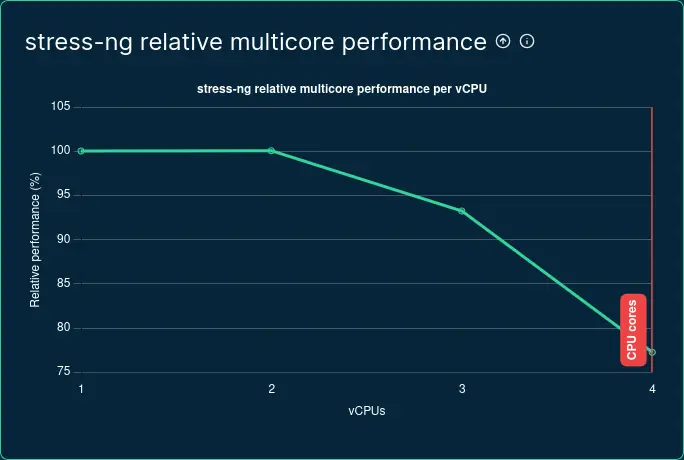
Multi core performance degradation on AWS m1.xlarge
(data collected and visualized by Spare Cores)
The CPU used here supports hyperthreading, but the machine reports to the OS that it’s not active (so we reflect
this in the data), supported by the fact that a 1 vCPU machine is also available as
m1.small. According to our graph,
with two out of four vCPUs in use, we achieve 200% performance (marked as 100% on the graph, as it doubles the
single-core performance), but performance drops drastically when using three or four cores.
This image raises the suspicion that, despite the kernel showing 4 physical cores, we may actually be getting a mix of logical and physical cores (or the VM scheduler is restricting us), though I couldn’t find information to confirm this.
Newer instances using the Xen hypervisor now run with HTT enabled, and this is not only accurately reported but also clearly reflected on the scalability graph.
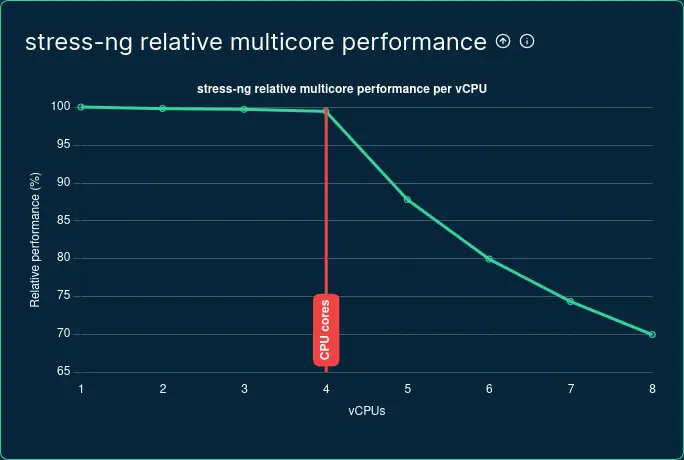
Multi core performance degradation on AWS x1e.2xlarge
(data collected and visualized by Spare Cores)
In terms of the scalability of our application, it makes a significant difference whether 2 vCPUs represent two physical cores or one physical core and one logical core (HT).
Rock or Metal? #
Just because we jump forward in time a bit and look at more recent instances, we can still see interesting things.

Multi core performance degradation on AWS c7i instance family
(data collected and visualized by Spare Cores)
The image shows four instances from the c7i series: c7i.48xlarge, c7i.metal-48xl, c7i.24xlarge, c7i.metal-24xl (comparison page).
The 48xl machines are dual-socket servers, while the 24xl machines have only one CPU.
What they have in common is that there are no neighbors; whether virtual or metal, only we are using them.
The following observations can be made:
- Up to the physical core count (48 or 96 cores), performance degrades in several steps.
- For the 48-core machine, we can only get maximum performance from significantly fewer than half of the cores (~18 out of 48), while the situation is slightly better for the 96-core machine. The cause of this phenomenon is likely reaching some power limit, Turbo Boost, or insufficient cooling.
- The graph suggests that the metal machines perform worse, but this is because the reference single-core performance is higher on metal machines, making the decline more apparent in multi-core operations compared to non-metal machines.
- If we only look at the number of vCPUs, we could be in trouble, as from a 96/192 vCPU machine, we can only extract the performance of about 40/80 cores.
- Unfortunately, it's not enough to just look at the number of vCPUs; we actually need to measure how the instance scales under your workload.
Frequency boosting (Turbo Boost etc.) #
The function, referred to with various marketing names, represents the CPU's ability to dynamically adjust its clock speed within its available power budget. For example, if we have a 192-core CPU, it likely has a power budget that could practically heat our living room. However, if we only load one (or a few) of those 192 cores, it will fall well below that power budget, allowing the clock speed to increase without overheating. There are many variations of this solution (adjusting one core, all cores, taking into account the manufacturing parameters of the cores, etc.), but we won’t go into those here.
But what does this have to do with the vertical scaling of an application capable of parallel execution?
It’s easy to see that even on a physical machine, it matters a lot. If your application is only lightly loaded, the processor can increase its clock speed, meaning that the performance per core will be higher than at the processor's base clock speed. If we start loading the CPU, it has to reduce its performance, ideally only down to the base clock speed (or to the so-called "all-core boost"), but in the worst case (e.g., with insufficient cooling), it might go even lower.
On your own computer, this is a measurable, observable process. But what about a cloud server, where we only get a portion of the machine, and thus have no influence on how others are loading it? The answer, unfortunately, depends on many factors, such as the CPU type, the cloud vendor's settings, or even the momentary effectiveness of the cooling.
But let’s look at an example!
Google's c4-highcpu-192 machine seems like a real beast: fifth-generation Intel Xeon Scalable CPUs. But how does
it perform in reality?
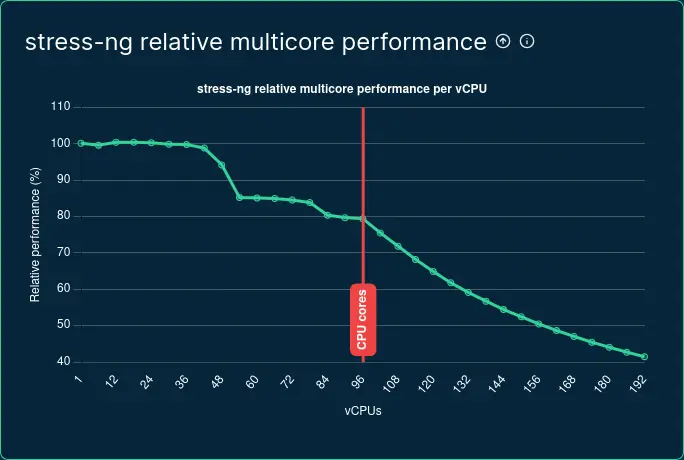
Multi core performance degradation on GCP c4-highcpu-192
(data collected and visualized by Spare Cores)
We can observe the following:
- The machine scales linearly up to about 36 cores.
- After that, there is a significant drop, likely because the Turbo Boost frequency was reduced.
- Above ~80 loaded cores, there is another drop, possibly because the processor could no longer maintain the all-core boost frequency due to cooling constraints.
Some cloud vendors offer options to modify boost settings. For example, Google provides the advancedMachineFeatures.turboMode option for the instance mentioned above, with the following description:
Turbo frequency mode to use for the instance. Supported modes include: *
ALL_CORE_MAXUsing an empty string or not setting this field will use the platform-specific default turbo mode.
If that isn't clear enough, the web UI provides a more understandable explanation:
By default, C4 VMs have a maximum frequency of 4.0 GHz. But frequencies can fluctuate, resulting in less consistent performance. When selected, this enables all-core turbo-only mode. vCPUs on your C4 VM will run at a maximum frequency of 3.1 GHz to increase performance consistency.
Our measurement above was made with default settings, but let's see how the performance per core changes with each setting:
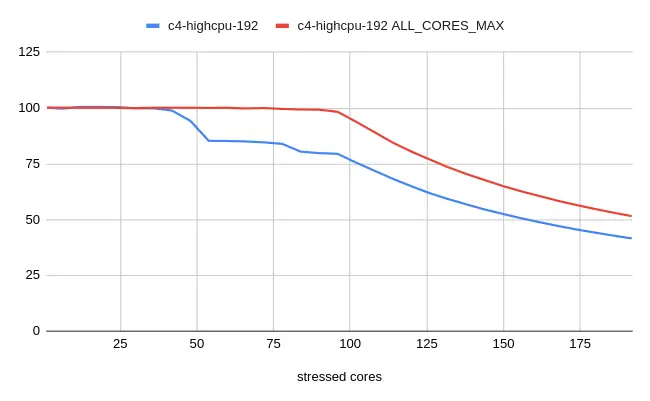
stress-ng scalability for GCP c4-highcpu-192
with and without ALL_CORES_MAX
(data collected and visualized by Spare Cores)
As you can see, with the ALL_CORES_MAX setting, the scaling is almost linear up to the number of physical cores (96).
But then, why isn't this the default?
Because, in general, we benefit more by letting the boost work:
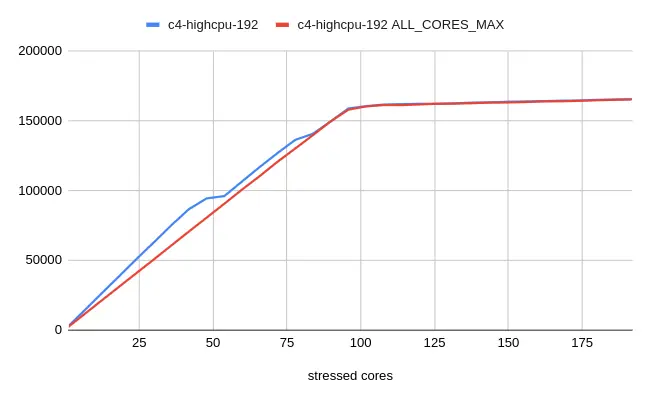
stress-ng score for GCP c4-highcpu-192
with and without ALL_CORES_MAX
(data collected and visualized by Spare Cores)
Up to about half of the physical cores, we get significantly higher performance per core (around 25% more).
Between roughly 50-78 cores, this advantage drops to about 5%, and beyond that, due to the base clock speed, the
machine can provide the same performance as with the ALL_CORES_MAX setting.
With the c4-highcpu-192 instance size, it's likely that we don't have any neighbors, meaning we have exclusive
control over the machine. However, with smaller instances, we won’t be as lucky. Let's see how those perform on their comparison page:

Scalability of multiple GCP c4 instance sizes
(data collected and visualized by Spare Cores)
A very interesting graph, reveals the following observations (red vertical lines indicate the physical core count of each instance):
- For the 192/96 vCPU instances, when the machine is loaded up to the number of physical cores (96/48), we get similar scaling. It’s likely that our neighbors use up most of the remaining power budget, causing the CPU clock speed to decrease.
- For smaller instances, when loading up to the physical core count, we can extract a much higher percentage of the single-core performance.
- For the smaller instances, performance fluctuations appear; instead of a flat curve at the beginning, it sometimes spikes wildly, which is a result of our neighbors "pulling" the CPU clock speed up and down.
What conclusion can we draw from this? If your application scales not only vertically but also horizontally (running on multiple machines instead of a larger one), it might be worthwhile to run on several smaller machines rather than a large one. This way, if we end up with neighbors who don't consume their share of the CPU budget, we can use it ourselves. In the worst-case scenario, we'll still extract as much (minus some VM overhead) as if we rented a single large machine, so ultimately, if we’re lucky, we get extra performance for free.
AMD vs. ARM vs. Intel? #
Let's see how each CPU performs in a 96 physical core configuration:

Scalability of different CPU manufacturers (AMD, ARM, Intel)
(data collected and visualized by Spare Cores)
As shown on their comparison page, with AMD (c7a.24xlarge), we only get physical cores, without HyperThreading, and the same is true for the
ARM-based machine (c8g.metal-24xl). In contrast, Intel (c7i.metal-48xl) shows 192 cores to the OS due to HTT, but
it still has 96 physical cores.
As we saw earlier, the shape of the Intel curve is influenced by Turbo. AMD also supports this technology, but its curve is completely linear, which means that either Turbo is turned off or it can maintain the increased frequency even under full load.
For reference, here are the actual scores achieved:

stress-ng scores for different CPU manufacturers (AMD, ARM, Intel)
(data collected and visualized by Spare Cores)
The ARM and Intel are practically neck and neck, with Intel's advantage coming solely from Turbo Boost, which it completely loses under full load. Meanwhile, AMD is leading by a wide margin in this test.
What about other providers? #
Unfortunately, it is quite difficult to find identical instances among the providers we are currently examining (AWS, Azure, GCP, and Hetzner Cloud).
Below, I compare machines with 24 physical cores, and to make the comparison meaningful, all are AMD processor-based
(since Hetzner only offers 24-core configurations with AMD). The guiding principle in selecting the specific types was
the highest overall stress-ng score.

stress-ng scalability at AWS, Azure, GCP and Hetzner Cloud
(data collected and visualized by Spare Cores)
As you can see on their comparison page, there is no significant difference in scalability, and under peak load, Hetzner provides the most
consistent performance with its ccx63 machine, followed by AWS's
c6a.12xlarge. Trailing significantly behind are Azure's
D48as_v5 and, lastly, Google's
n2d-highcpu-48 machine.
The chart showing the actual scores indicates that I managed to select machines with similar capabilities.

stress-ng scores at AWS, Azure, GCP and Hetzner Cloud
(data collected and visualized by Spare Cores)
The machines from Microsoft and Google seem almost identical. Hetzner's advantage here might not be unexpected, as it is their largest instance, meaning we likely don't have to share the machine with anyone.
On the related comparison page, you can also compare other parameters of the machines, including the currently lowest prices, where Hetzner leads by less than half the price compared to all the other major providers, earning them the virtual crown.
Summary #
In this article, I tried to explore what considerations are worth taking into account when choosing cloud resources for a vertically scaling application, and I concluded the following:
- If single-core performance is important, feel free to choose a machine with Turbo Boost (or similar) enabled! Spare Cores helps find the best single-core performance machine.
- If your application frequently needs to use many cores, you should definitely measure its performance on the selected machines, using the scaling graphs on Spare Cores as a guide.
- "Neighbors" can significantly affect your machine's performance. It's possible that using multiple smaller machines is better than using a large one!
- Hyper-Threading is still present in our lives, but it's worth using it cautiously and measuring how your application performs with it. It may be worth disabling it (if the provider allows) or software-limiting the CPU cores used.
- In terms of pricing, even the "big players" can vary significantly, but if your cloud environment permits, it may be worthwhile to look beyond them as well.
